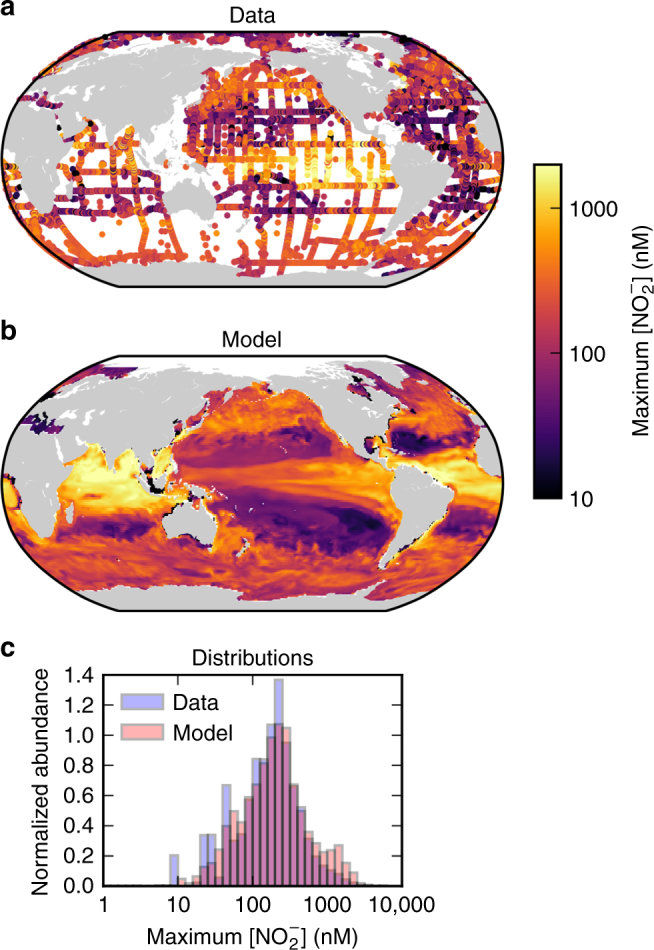
Fig. 5.

Observed and simulated maximum nitrite concentration in the oxygenated water column. a From the GLODAPv2 database60, 61, b from the global model, and c the distributions of both. Only locations that co-occur with O2 concentrations greater than 10 μM are plotted. (Note: a threshold of 50 μM O2 results in visually indistinguishable versions of a and b.) Map generated with Python version 3.5.1, Matplotlib version 1.5.1, and Basemap version 1.0.786
