
FIGURE 4.
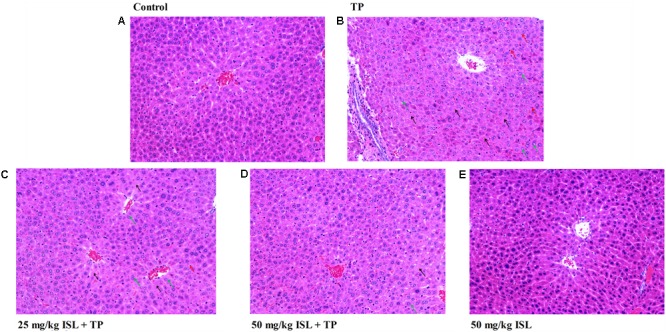
Photomicrographs (× 200) of hematoxylin & eosin-stained liver sections obtained from the (A) control, (B) TP (1.0 mg/kg), (C) ISL (25 mg/kg) + TP (1.0 mg/kg), (D) ISL (50 mg/kg) + TP (1.0 mg/kg), and (E) ISL (50 mg/kg) groups. Green arrows indicate hepatocellular hydropic degeneration, black arrows indicate necrosis, and red arrows indicate inflammatory cell infiltration.