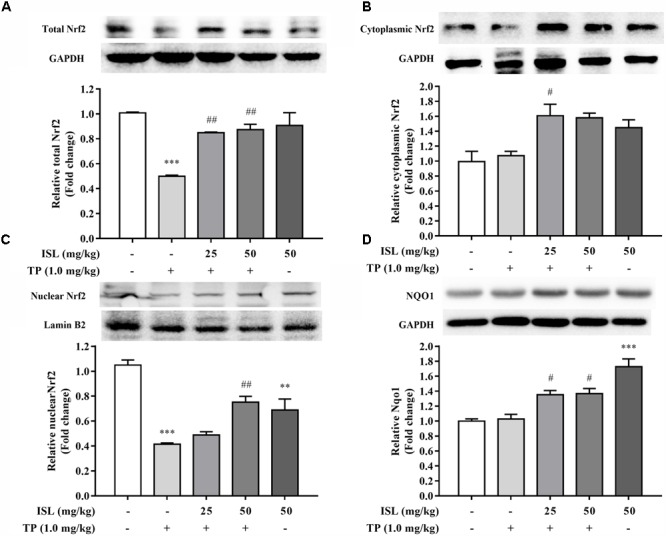
FIGURE 5.

Effects of TP, ISL, or ISL + TP on protein levels of (A) total, (B) cytoplasmic, and (C) nuclear Nrf2 and (D) Nqo1 in mouse livers. Cell lysates were analyzed by Western blot. Data were presented as means ±SE (n = 5); ∗∗P < 0.01 vs. the control group,∗∗∗P < 0.001 vs. the control group, #P < 0.05 vs. the TP group, and ##P < 0.01 vs. the TP group.
