
Fig. 6.
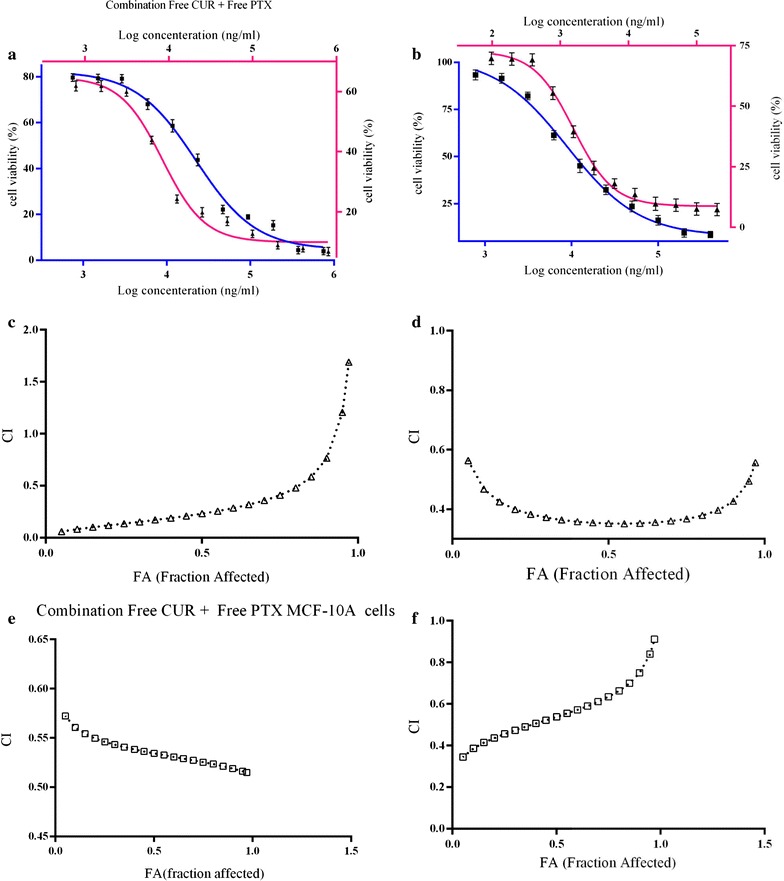
Analysis of synergy between curcumin and paclitaxel for MCF-7 (filled triangle) and MCF-10A (filled square) cells. a Dose–response curve of free CUR + Free PTX; b dose–response curve of Nio CUR + Nio PTX. CI values at different levels of growth inhibition effect (fraction affected, FA; c Free CUR + Free PTX in MCF-7 cells; d Nio CUR + Nio PTX in MCF-7 cells; e Free CUR + Free PTX in MCF-10A cells, f Nio CUR + Nio PTX in MCF-10A cell