
Fig. 1.
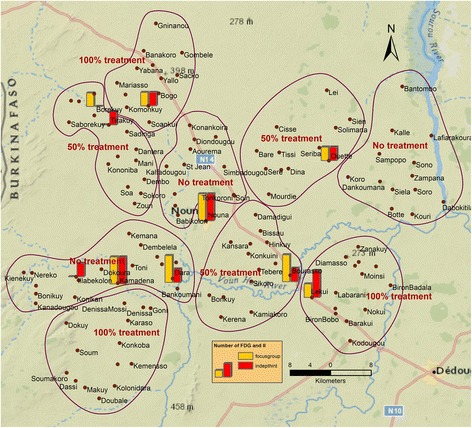
Study area with intervention and control clusters. Bars indicate villages in which FGD (yellow) and II (red) were performed; bar heights indicate their number (one or two)
Official websites use .gov
A
.gov website belongs to an official
government organization in the United States.
Secure .gov websites use HTTPS
A lock (
) or https:// means you've safely
connected to the .gov website. Share sensitive
information only on official, secure websites.
Study area with intervention and control clusters. Bars indicate villages in which FGD (yellow) and II (red) were performed; bar heights indicate their number (one or two)