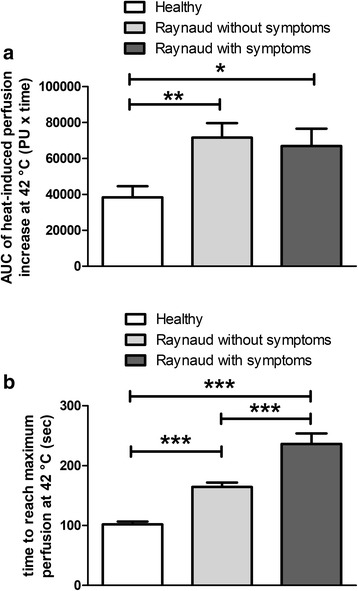
Fig. 3.

Heat-induced hyperaemia response (a), and (b) latency to reach the maximal response. Columns represent the means±SEM of each group (*p < 0.05, ** p < 0.01, ***p < 0.001; one-way ANOVA followed by Neuman-Keuls multiple comparison test)

Heat-induced hyperaemia response (a), and (b) latency to reach the maximal response. Columns represent the means±SEM of each group (*p < 0.05, ** p < 0.01, ***p < 0.001; one-way ANOVA followed by Neuman-Keuls multiple comparison test)