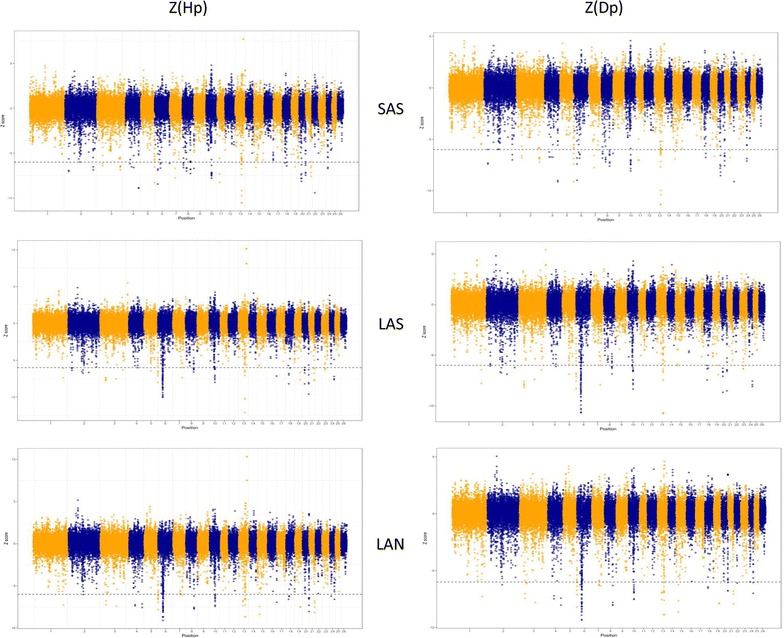
Fig. 1.

Distribution of Z-transformed average pooled heterozygosity (Z(Hp)) and pooled Tajima’s D (Z(Dp)) plotted along sheep autosomes 1 to 26 (alternately colored) for Sasi Ardi (SAS) and both Latxa populations either included in the genetic improvement program (LAS) or not (LAN). A dashed horizontal line indicates the cut-off (Z = − 6) used for extracting outliers
