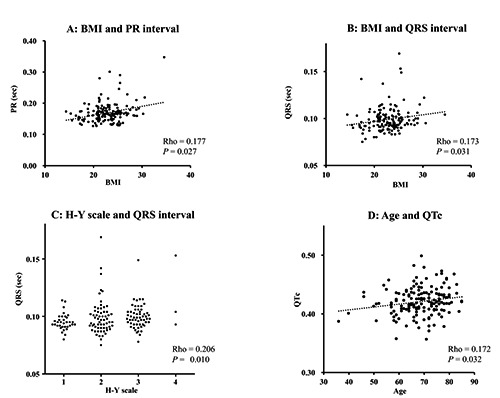
Figure 1.

Scatter diagrams showing the relationship between clinical features and electrocardiogram parameters. Body mass index was positively correlated with PR (A) and QRS (B) intervals. QRS interval was positively correlated with Hoehn and Yahr (C) stage, and QTc was positively correlated with age (D).
