Fig. 2.

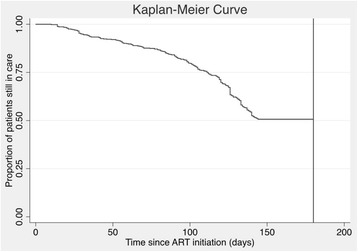
Kaplan-Meier curves showing the proportion of patients in care over time. Patients with a visit in the final 35 days of follow-up were considered to be in care at 180 days

Kaplan-Meier curves showing the proportion of patients in care over time. Patients with a visit in the final 35 days of follow-up were considered to be in care at 180 days