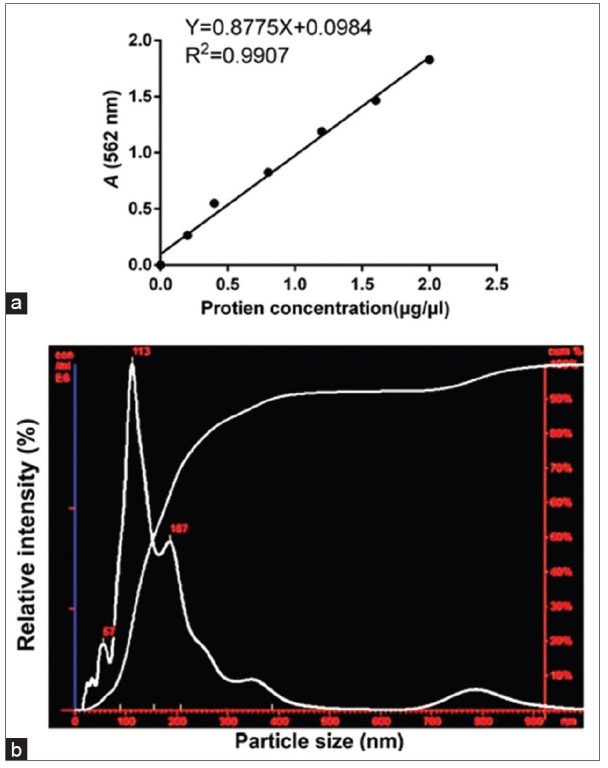
Figure 5.

The quantification and characterization of exosomes. (a) BCA method was performed to quantify protein concentration. Protein concentration standard curve was shown. After calculation, the extraction of the protein concentration of exosomes was 5.54 μg/μl. (b) NTA evaluation shows small vesicles within the expected range of exosomes (40–200 nm) in the sample isolated from the ADSCs culture medium by ultracentrifugation. BCA: Bicinchoninic acid; NTA: Nanoparticle tracking analysis; ADSCs: Adipose-derived stem cells.
