. 2018 Mar 20;131(6):713–720. doi: 10.4103/0366-6999.226899
Copyright: © 2018 Chinese Medical Journal
This is an open access article distributed under the terms of the Creative Commons Attribution-NonCommercial-ShareAlike 3.0 License, which allows others to remix, tweak, and build upon the work non-commercially, as long as the author is credited and the new creations are licensed under the identical terms.
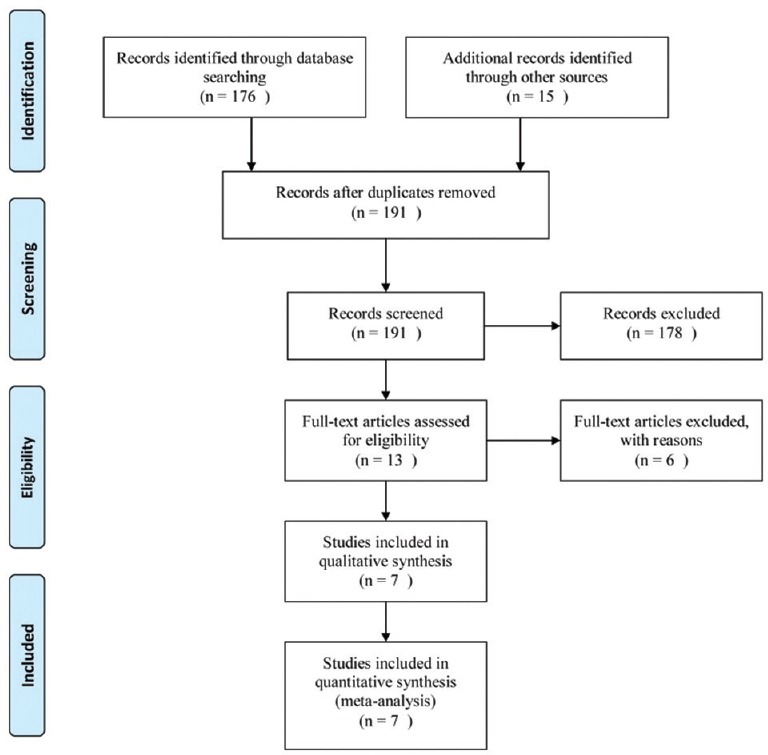
Figure 1.

Flow chart of the studies included in the meta-analysis.
