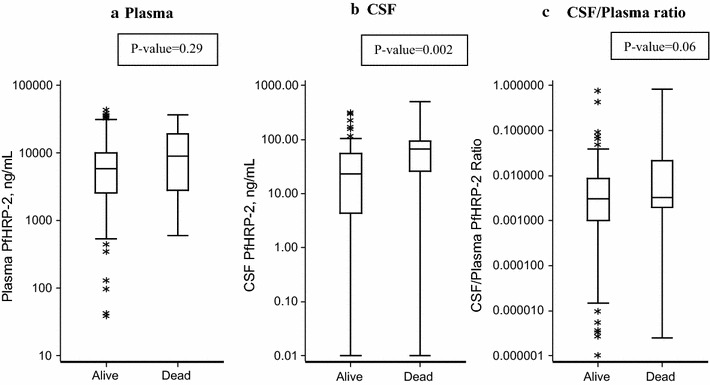
Fig. 3.

Comparison of PfHRP2 levels in a plasma, b CSF, and c the CSF/plasma ratio in patients who survived compared to those who died. Line represents median value, box extends from first quartile to third quartile, whiskers extend to 5th and 95th percentile, and asterisks represent data points outside this range
