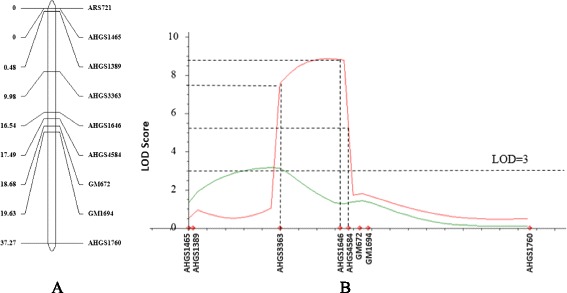
Fig. 3.

Linkage map (a) and quantitative trait locus (QTL) analysis (b) with nine simple sequence repeat (SSR) markers. The total length of linkage map is 37.27 cM, with two markers located at the same position. For the QTL analysis, phenotyping results from both visual rating and enzyme linked immunosorbent assay (ELISA) test are included, and represented using green and red lines respectively
