
Fig. 2.
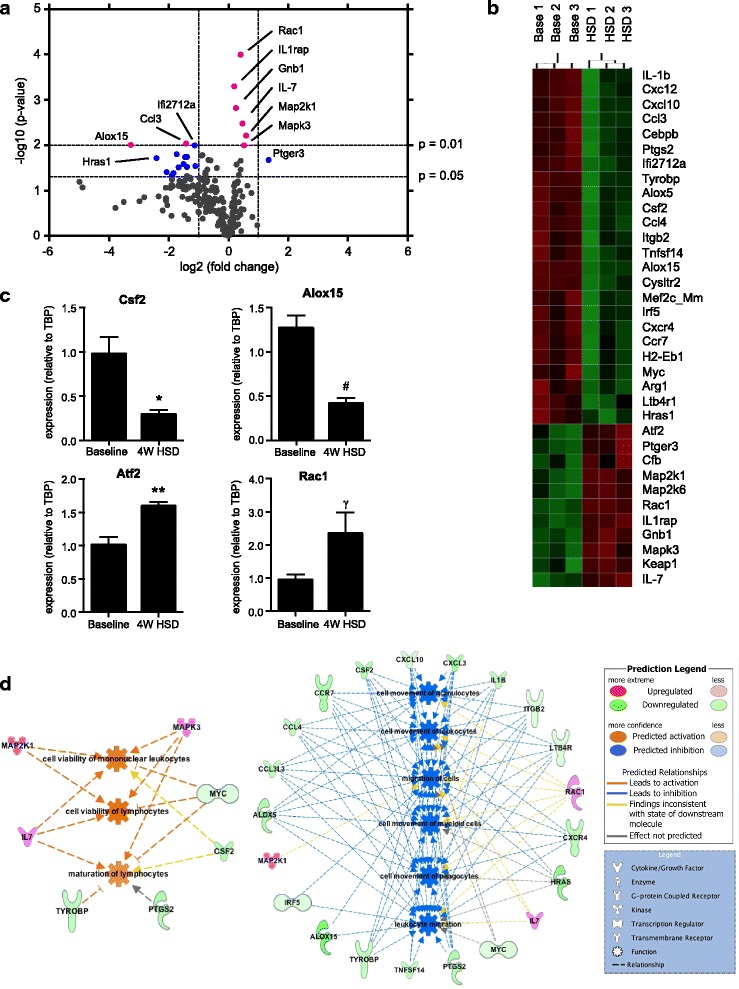
High salt diet modulates immune expression in colonic lamina propria. a Volcano plot of gene expression in colonic lamina propria total cell extract of mice receiving HSD or control diet for 4 weeks, n = 9 mice/group. Pink dots: genes with p < 0.01. Blue dots: genes with 0.01 < p < 0.05, fold change > 2. b Heatmap of immune genes that changed with HSD (p < 0.05). Based on group average, Euclidean distance metric. c qRT-PCR analysis of differentially expressed genes in the two groups. Values are presented as means ± SEM, n = 5–6 colon/group, *p < 0.05, **p < 0.01, #p < 0.001, γp = 0.065. d Gene-cell function networks obtained from Ingenuity Pathway Analysis. On the left, network with the genes that contribute to the predicted inhibition of functions related to immune cell migration, and, on the right, network with the genes that contribute to the predicted upregulation of the immune cell viability and maturation