
Fig. 4.
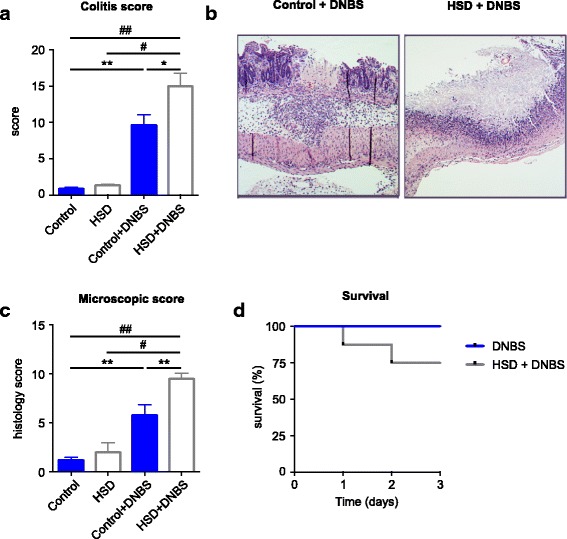
High salt diet exacerbates DNBS colitis. a DNBS colitis macroscopic scores at endpoint (day 3) in four groups of mice: control (control diet, 50% EtOH vehicle), HSD (high salt diet, 50% EtOH vehicle), DNBS (control diet, DNBS in 50% EtOH vehicle), HSD + DNBS (high salt diet, DNBS in 50% EtOH vehicle). b Representative H&E-staining of colonic section of DNBS mice highlighting the ulcers in the mucosa. c Histological scores in colonic sections. d Survival curve of the two groups with DNBS colitis. Colitis and histology scores are presented as means ± SEM; n = 5–9 mice/group. *p < 0.05, **p < 0.01, #p < 0.001, ##p < 0.0001