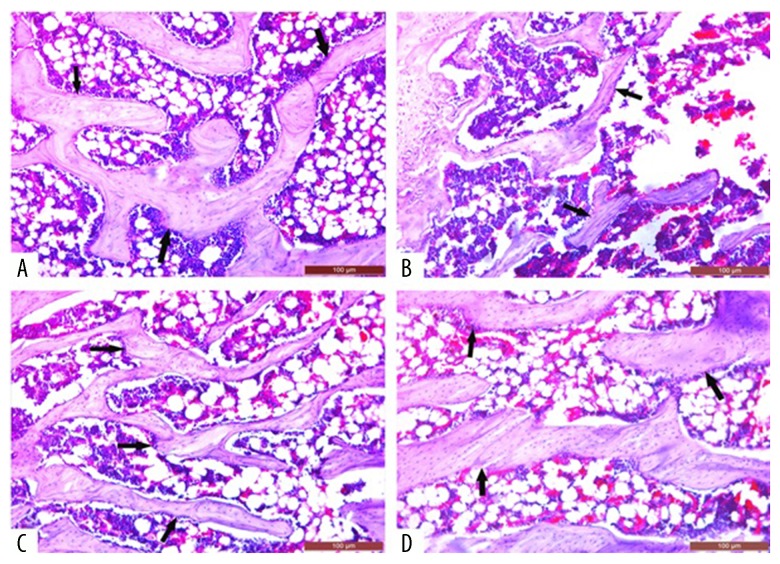
Figure 2.
Images showing the bone mineral density (BMD) of the right femoral head in rats with glucocorticoid-induced osteoporosis (GIOP). (A) The control (untreated) group. (B) The dexamethasone-treated group. (C) The dexamethasone + zaprinast-treated group. (D) The dexamethasone + avanafil-treated group. The channels indicate mineral deposits. Scale bar: 100 μm.

