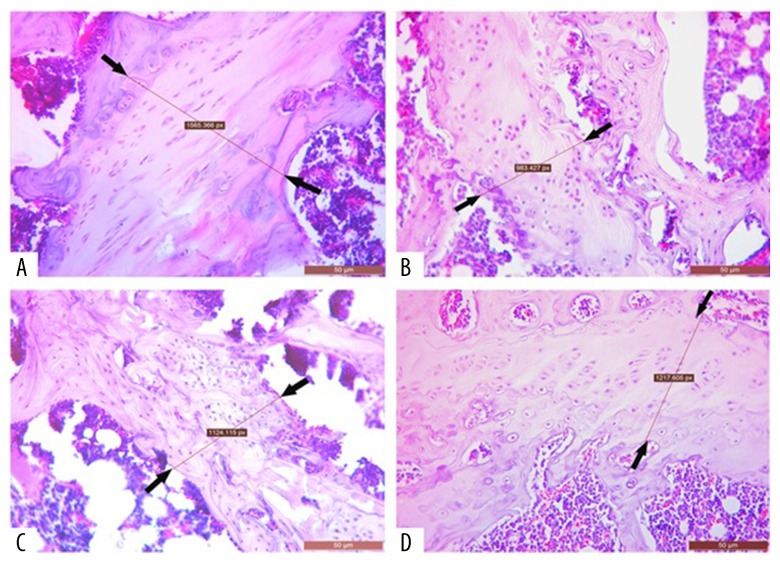
Figure 3.
Images showing the right femur epiphyseal bone width in rats with glucocorticoid-induced osteoporosis (GIOP). (A) The control (untreated) group. (B) The dexamethasone-treated group. (C) The dexamethasone + zaprinast-treated group. (D) The dexamethasone + avanafil-treated group. The area or distance between of the two arrows indicates the epiphyseal area (bone growth plate). Scale bar: 50 μm.

