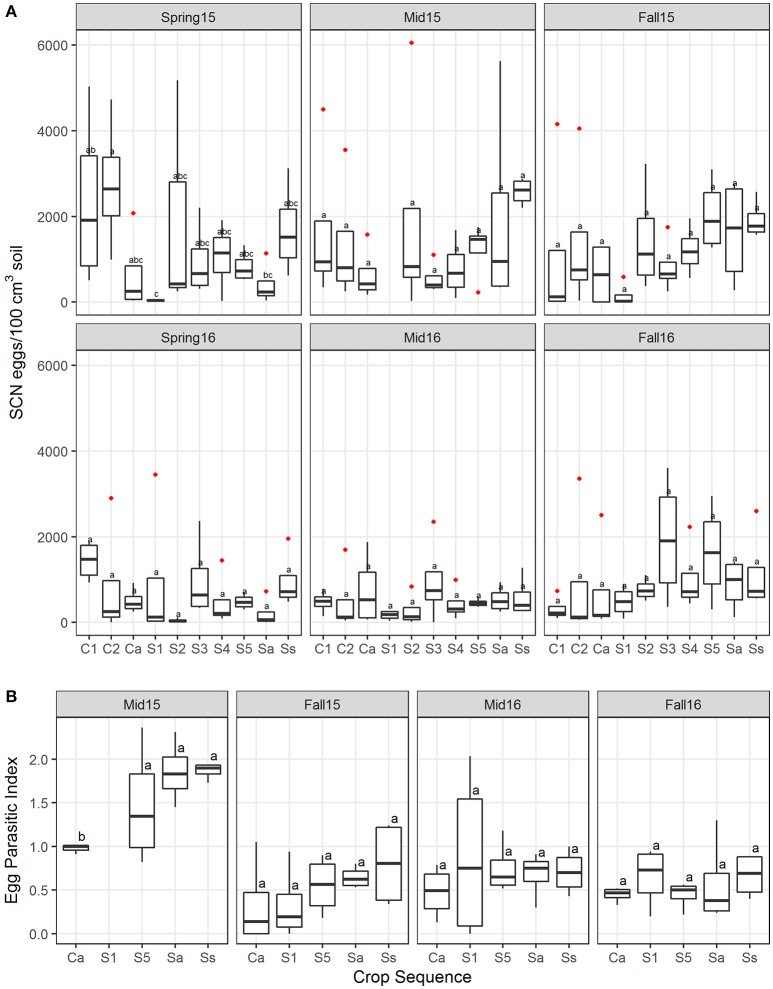
Figure 2.
Soybean cyst nematode egg population density and EPI. (A) Boxplots showing the median and interquartile ranges across four replicates of SCN egg density measured as the number of eggs/100 cm3 soil at each sampling season (spring, midseason, and fall in 2015 and 2016). (B) Egg-parasitic index (EPI) across crop sequences and season showing median and first through fourth quartiles. Letters indicate differences that were significant (P < 0.05) by Tukey's LSD test and red dots are outliers. Crop sequence treatments include first (C1) and second (C2) year of corn following a 5 year soybean rotation, annual rotation of corn (Ca) following annual rotation of soybean (Sa), years one through five (S1–S5) of soybean following a 5 year corn rotation, and continuous corn (Cc) and susceptible soybean (Ss) monoculture.

