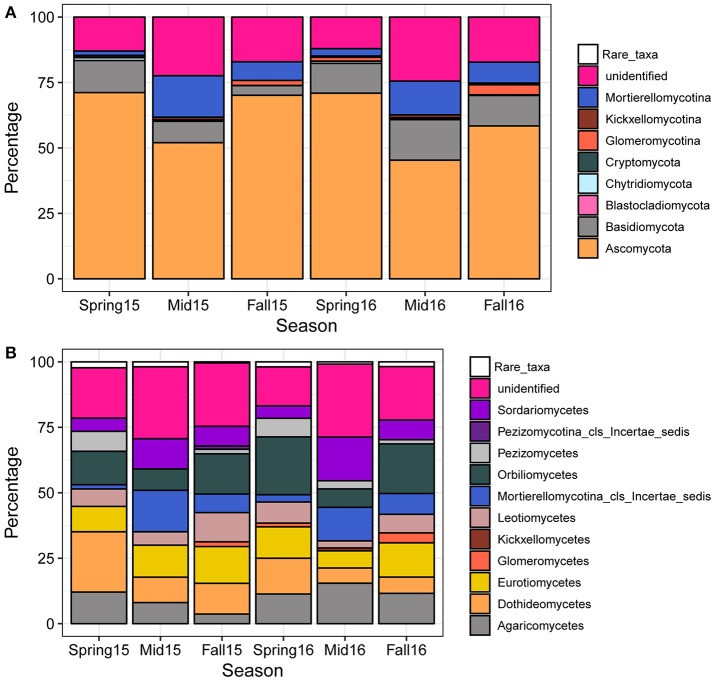
Figure 3.
Percentage of fungal OTUs mapping to fungal phyla, subphyla, and classes across seasons. Each bar represents the average proportion of phyla (A) or classes (B) of all the samples within the sampling time point (spring, midseason, and fall). The category “Rare_taxa” includes all classes that had <0.1% relative abundance.

