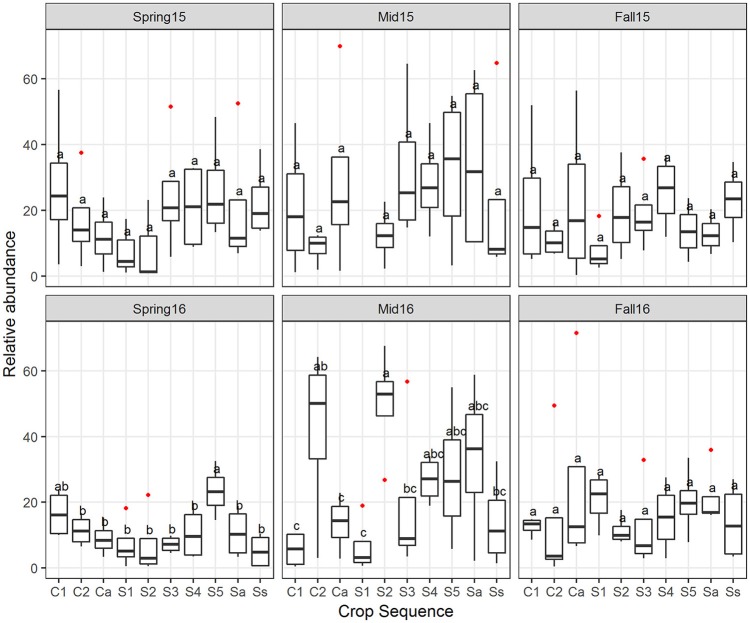
Figure 9.
The relative abundance of potential egg-parasitic fungi affected by crop sequence. Boxplots showing median and interquartile range of relative abundance of potential egg-parasitic fungi across crop sequences. Crop sequences include first (C1) and second (C2) year of corn following 5 year soybean rotation, annual rotation of corn (Ca) following annual rotation of soybean (Sa), years one through five (S1–S5) of soybean following a 5 year corn rotation, and continuous corn (Cc) and susceptible soybean (Ss) monoculture. Different letters indicate significant differences at P < 0.05 across crop sequences using Tukey's HSD test. Red dots indicate outliers.

