Figure 7.
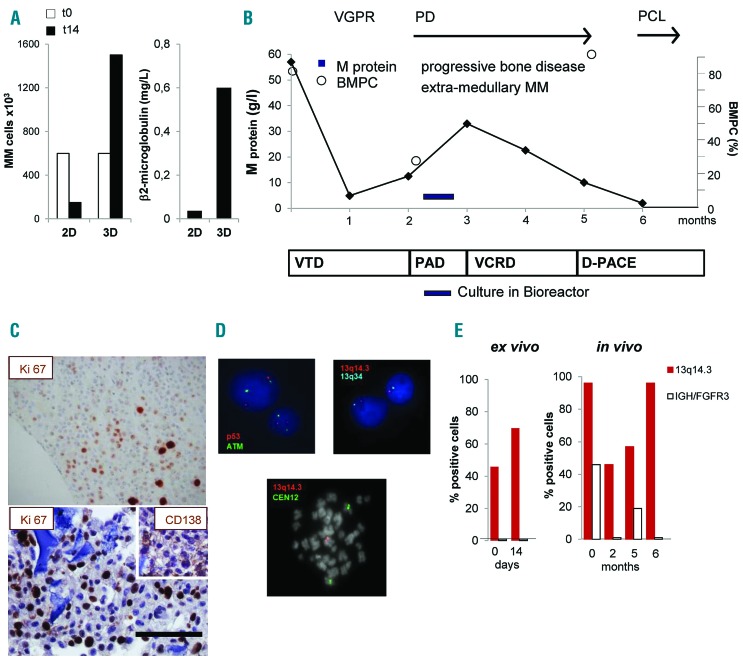
Culture in bioreactor mirrors the expansion of an in vivo proliferating multiple myeloma (MM) sub-clone. (A) Primary MM cell number (left panel) and β2 microglobulin release in supernatant (right panel) after 14 days of culture under parallel 2D and 3D co-cultures with HS-5 cells. (B) Schematic representation of patient’s clinical course and treatments. After diagnosis (t0), response to treatment was assessed and defined as Very Good Partial Response (VGPR), Progressive Disease (PD), Plasma Cell Leukemia (PCL). Serum M protein concentration and percentage of bone marrow PC (BMPC) were serially determined. Treatments were: bortezomib-thalidomide-dexamethasone (VTD), bortezomib-doxorubicin-dexamethasone (PAD), bortezomib-cyclophosphamide-lenalidomide-dexamethasone (VCRD), dexamethasone-cisplatin-adriamycin-cyclophosphamide-etoposide (D-PACE). (C) Immunohistochemistry of the proliferation marker Ki-67 inside a scaffold (lower) and in a matched bone biopsy (upper). Insert represents CD138 staining. Bar=100 mm. (D) Interphase fluorescence in situ hybridization analysis performed in purified MM cells retrieved upon culture in bioreactor (upper), showing normal pattern of ATM and p53 (upper left) and 13q14.3/13q34 deletion (upper right); in the lower panel, a spontaneous metaphase of a PC showing 13q14.3/13q34 deletion. (E) Percentage of cells carrying the 13q14.3/13q34 deletion or IGH/FGFR3 translocation ex vivo and in vivo.

