Figure 4.
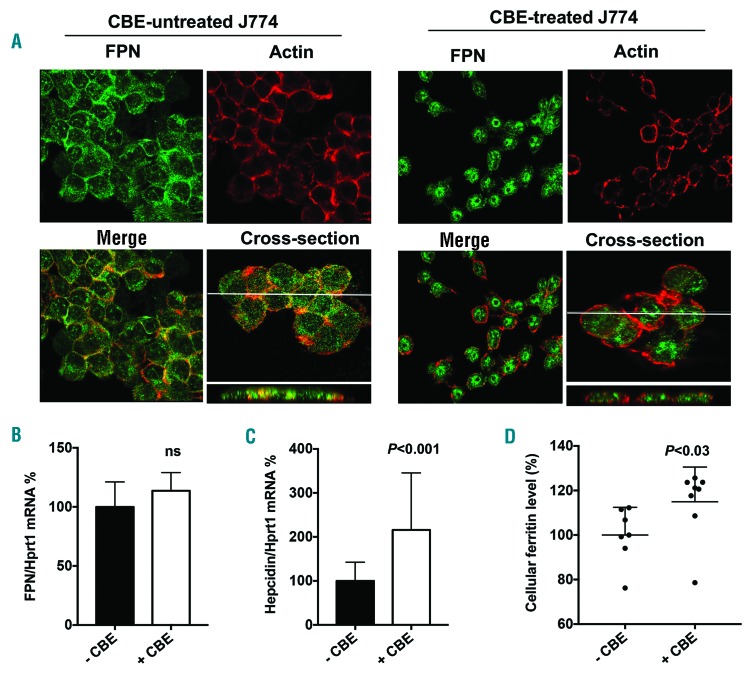
Impact of glucocerebrosidase activity inhibition on ferroportin (FPN) and hepcidin expression in the J774 cell line. J774 cells were incubated with 1 mM CBE (+CBE) or with vehicle (-CBE) for 96 hours (h). (A) Staining of FPN and actin were performed as described in the Methods section. FPN is labeled in green and actin in red. In the absence of CBE, FPN is stained mostly at the plasma membrane with some intracellular extent. In the presence of CBE, FPN membrane staining was reduced, and its localization was mostly intracellular. The cross-section images demonstrated a significant overlap of FPN and actin staining in the -CBE condition but not in the +CBE condition. Images were taken by confocal microscopy (60X). (B and C) Quantification of the mRNA expression levels of FPN (B) and hepcidin (C) from treated and untreated J774 cells. Data were normalized by the housekeeping transcript Hprt1 and expressed as the percentage of the -CBE group mean±Standard Error of Mean. Mann-Whitney test was used to compare RNA levels. (D) Quantification of ferritin in cellular extracts from treated and untreated J774 cells. Data were expressed as percentage of the control mean. Medians are represented by the horizontal line. According to a two-tailed Mann-Whitney test, the level of cellular ferritin was significantly higher in the CBE treated cells; P=0.021.

