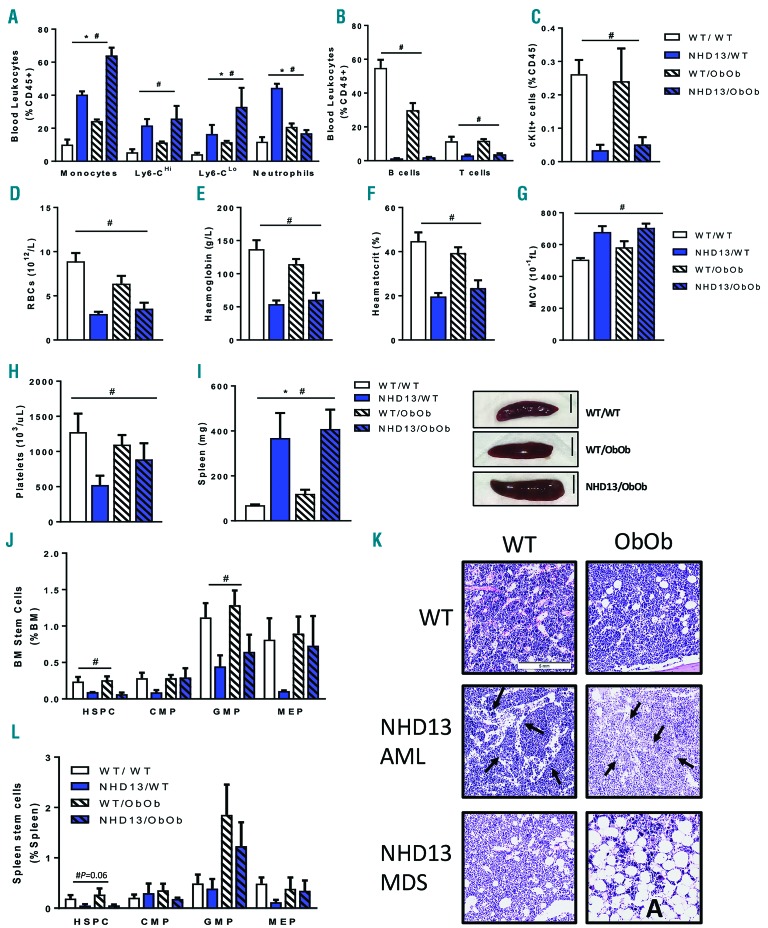
Figure 3.
Ob/Ob mice exhibit a similar disease phenotype at MDS/AML endpoint despite aggravated monocytosis. Ob/Ob mice and WT littermate controls transplanted with either WT or NHD13 bone marrow (BM) were followed until the development of MDS symptoms required euthanasia. Blood flow cytometry analysis of (A) myeloid cells, (B) lymphocytes and (C) progenitor cells. CBC analysis of (D) red blood cells, (E) hemoglobin, (F) hematocrit, (G) mean corpuscular volume and (H) platelets. (I) Spleen weights and representative images, scale 0.5cm. (J) Flow cytometry analysis of HSPCs and myeloid progenitors in the BM. (K) Representative images of BM from lean and Ob/Ob mice, arrows indicate dilated blood vessels, A indicates adipocytes. (L) Flow cytometry analysis of HSPCs in the spleen. (A–I); n=11–16; (J–L); n=4–8. All data expressed as mean ± SEM. *P<0.05, for obesity effect; #P<0.05, for MDS effect as analyzed by 2-way ANOVA. WT: wild-type; RBC: red blood cell; HSPC: hematopoietic stem and progenitor cell; CMP: common myeloid progenitor; GMP: granulocyte-macrophage progenitor; MEP: megakaryocyte-erythroid progenitor; MCV: mean corpuscular volume.

