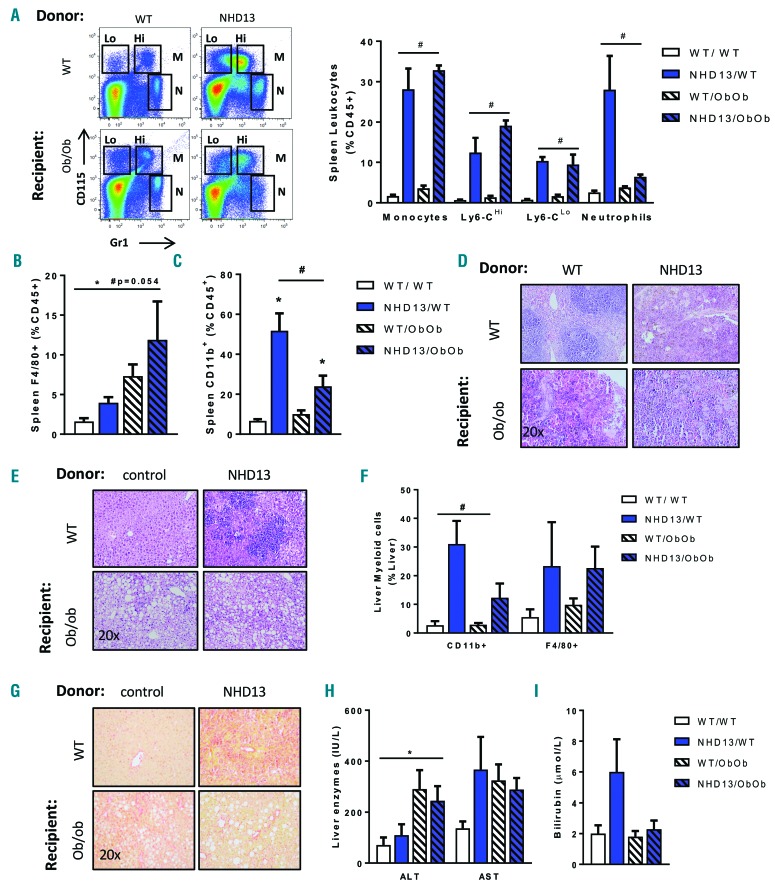
Figure 5.
Spleen and liver parameters in response to MDS/AML in Ob/Ob mice. Spleen analysis by flow cytometry including (A) monocytes and neutrophils, (B) macrophages (F4/80+) and (C) activated myeloid cells (CD11b+). (D) Histological H&E staining of the spleen. Liver analysis by (E) histological H&E analysis, (F) flow cytometry analysis of hepatic immune cells, including activated myeloid cells (CD11b+) and macrophages (F4/80+) and (G) PicroSirius red staining of liver for collagen visualization. Plasma analysis of (H) liver enzymes alanine amino transferase (ALT) and aspartate amino transferase (AST) and (I) bilirubin. (A–G); n=4–8; (H–I); n=5–7. All data expressed as mean ± SEM. *P<0.05, for obesity effect; #P<0.05, for MDS effect as analyzed by 2-way ANOVA. WT: wild-type.

