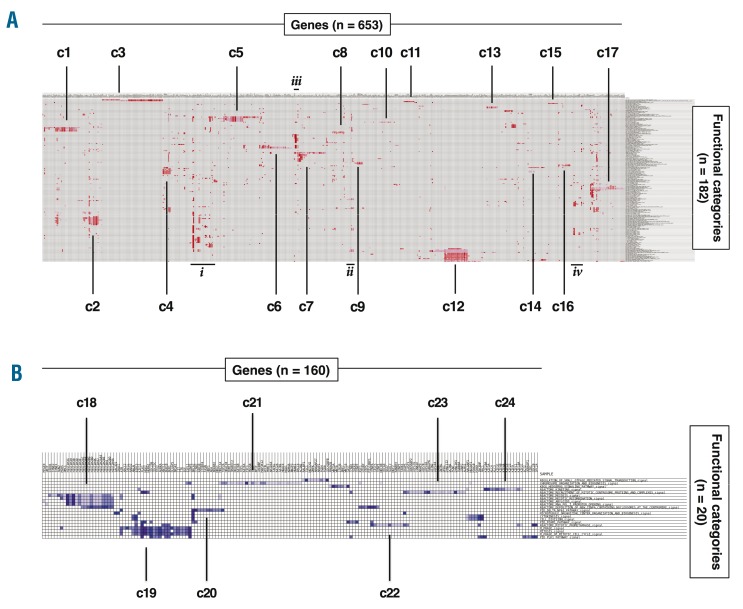
Figure 3.
Identification of functionally related clusters of genes by Gene Set Enrichment Analysis leading edge analysis. Heatmaps showing clustering of functional categories and leading edge genes that are up-regulated (A) or down-regulated (B) in adherent Jeko-1 cells relative to suspension of Jeko-1 cells in co-cultures. The numbers of leading edge genes and functional categories are shown in each panel: 24 clusters (c1-c24), defined as having ≥10 genes and ≥1 functional categories, were identified (see Table 2 for more details). Four additional groups of genes that contain many functional categories but which do not fulfill the cluster criteria are denoted i–iv.

