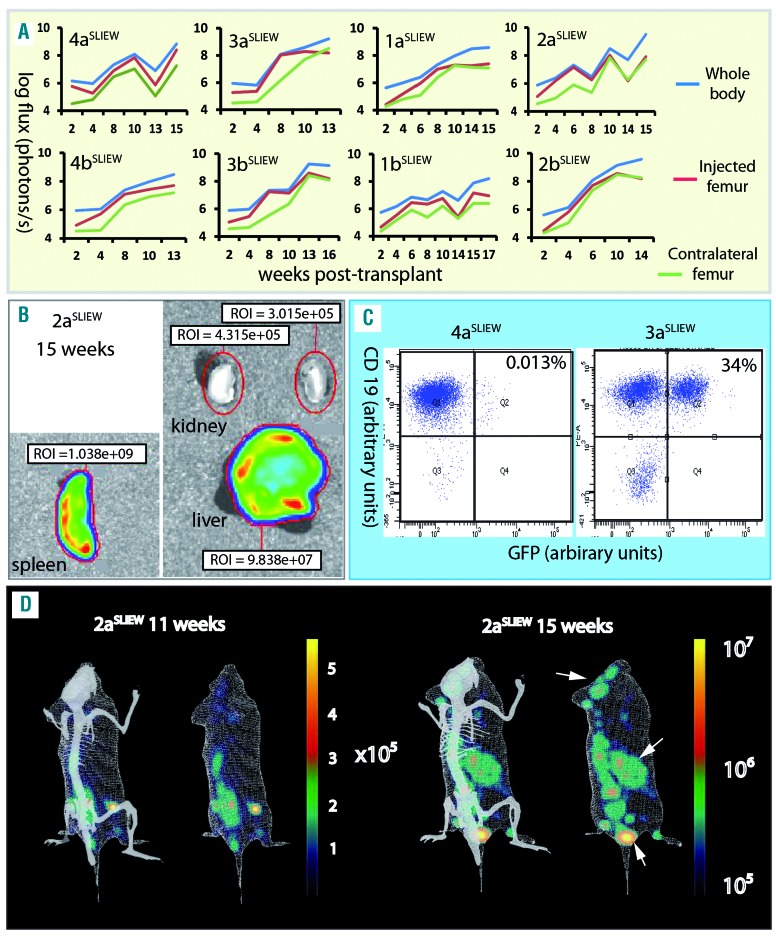
Figure 1.
In xivo and ex-vivo imaging of xenografts. (A) Serial quantification of the luminescent signal from injected and contralateral femora and the whole body for each xenograft suggesting variations in the rate at which cells migrate from the site of injection and the degree to which different sites are infiltrated by transduced cells. For example, in 3a/bSLIEW the strength of signal from the contralateral femur lagged substantially behind that of the injected femur until weeks 10–13, while in 1a/bSLIEW and 2bSLIEW the two femora showed similar levels from week 2. (B) Example of ex-vivo imaging of dissected organs showing total luminescent readings for spleen, liver and kidney. Images are representative of six animals analyzed. (C) Examples of FACS analysis of cells isolated from the spleens of 3aSLIEW and 4aSLIEW, demonstrate marked contrast in the proportion of CD19-positive cells that are EGFP-positive. (D) A single example of serial three-dimensional reconstructions of luminescent signals in 2aSLIEW, 11 and 15 weeks after transplant. Arrows point to regions of the skull, spleen and a third site showing strong signal increase between these two time points. The skeleton projected for orientation is not derived from this animal.

