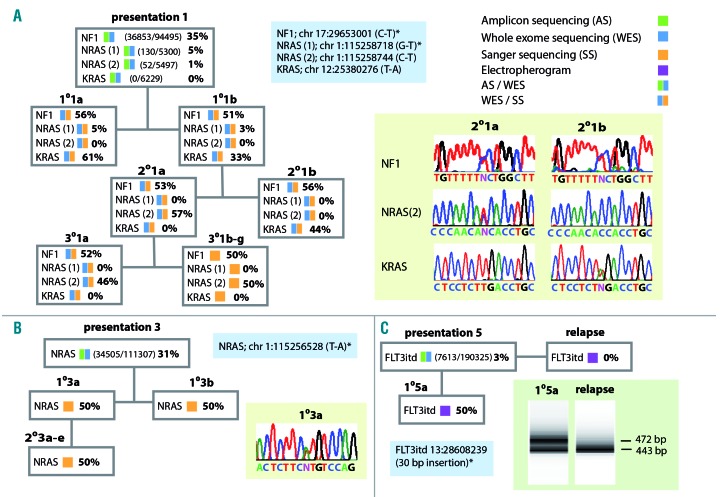
Figure 4.
Analysis of mutations affecting the RAS pathway. The key to the analytical methods used are shown top right. Blue boxes show non-synonymous RAS pathway mutations identified. White boxes summarize the estimated variant allele (VA) frequencies and methods of analysis used for patients’ and xenograft samples. (A) In patient 1 an NF1 mutation was clonal at presentation and in all xenografts. By contrast mutations of NRAS and KRAS showed marked fluctuations in VA frequency; NRAS (1), present in the patient as a sub-clone, was detected in both 1° xenografts but not in blasts from 2° and 3° animals. NRAS (2), identified by high depth targeted sequencing in 1% of patients’ sample reads, was undetected by whole exome sequencing in primografts but emerged as a dominant clone in 2°2a and all derivative 3° xenografts. A mutation of KRAS, although undetected in more than 6000 reads by targeted sequencing of the patient’s sample, marked the dominant clone present in primografts and 2°2b. Sanger sequence traces illustrate the relationship between the NF1, NRAS (2) and KRAS mutations in the two 2° xenografts, traces shown for 2°1a are also representative of 1°1a and 1°1b, traces shown for 2°1b are also representative of 3°1a-g. (B) In patient 3 an NRAS mutation identified in the patient remained clonal in all 1° and 2° xenografts. The Sanger sequencing trace shown for 1°3a is representative of all xenografts. (C) In patient 5 a FLT3 itd, detected as a minor sub-clone by exome sequencing of the presentation sample, became dominant in the 1° xenograft as demonstrated by the generation of two distinct exon 14 polymerase chain reaction (PCR) amplicons of equal intensity (first lane bottom right). In contrast only a single PCR product was amplified from the relapse sample of this patient (second lane bottom right). Mutations detected in the patients’ presentation samples have been previously published.13

