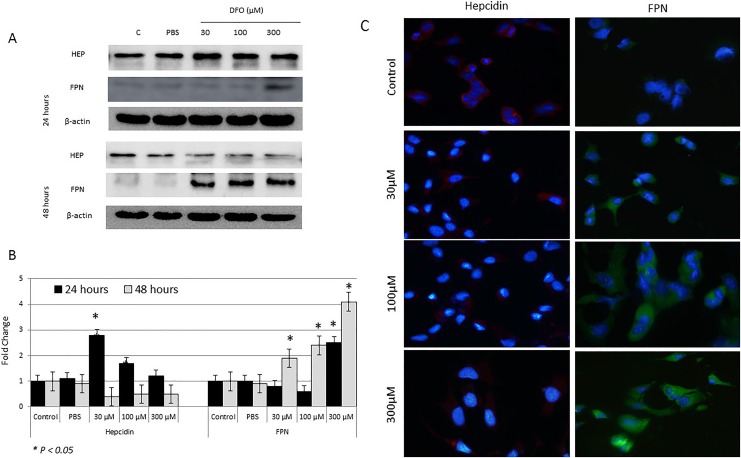
Figure 3.
Assessment of cytoplasmic hepcidin and ferroportin (FPN) protein levels in control and deferoxamine (DFO)-treated MCF-7 cells. A, Lysates of cells treated with 30, 100, or 300 µM DFO and those of controls were assessed for hepcidin and FPN by Western blotting at 24 and 48 hours posttreatment. B, Calculated fold change in protein expression levels in treated and controls cells based on 3 separate experiments ± SEM. C, Assessment of cytoplasmic hepcidin and FPN expression by immunofluorescence in control and treated cells at 48 hours; a sample urn of 3 separate experiments. B, The presence of a statistically significant difference (P > .05) in protein expression levels between treated cells and untreated controls at the specific time point is denoted by *.

