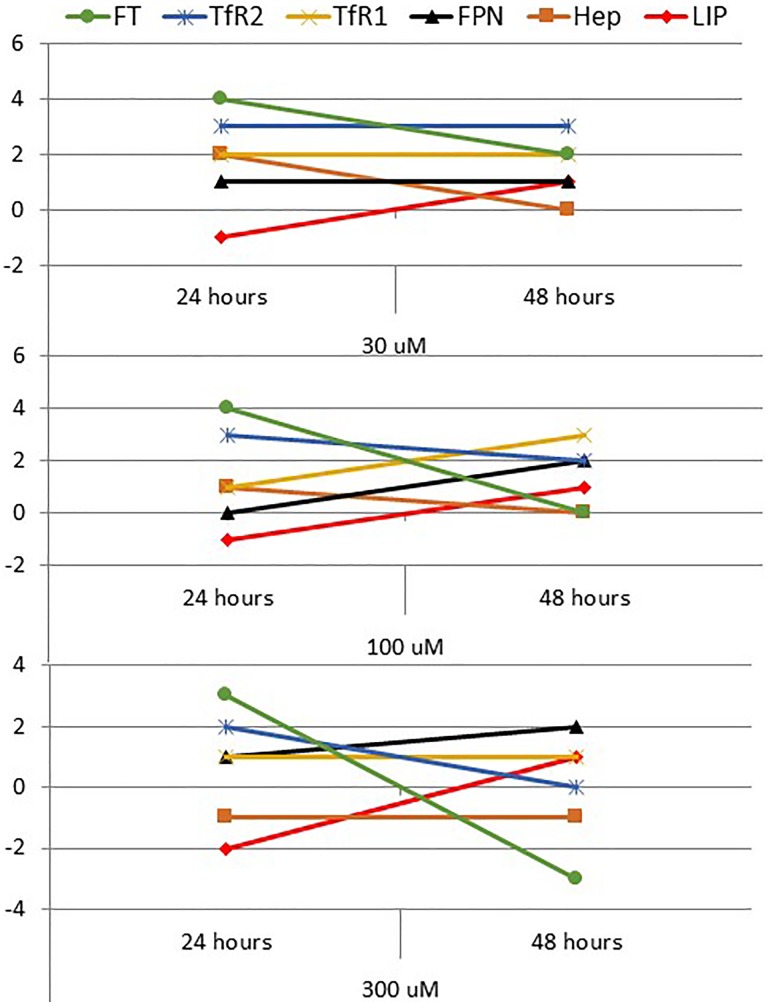
Figure 8.
Summary figure of the trend of change in labile iron pool (LIP) and iron regulatory proteins in treated cells when compared with untreated controls at 24 and 48 hours. A change in any parameter was arbitrarily defined as 0 (no change), 1 (minor), 2 (intermediate), or 3 (major) in the up (+) or down (−) direction.

