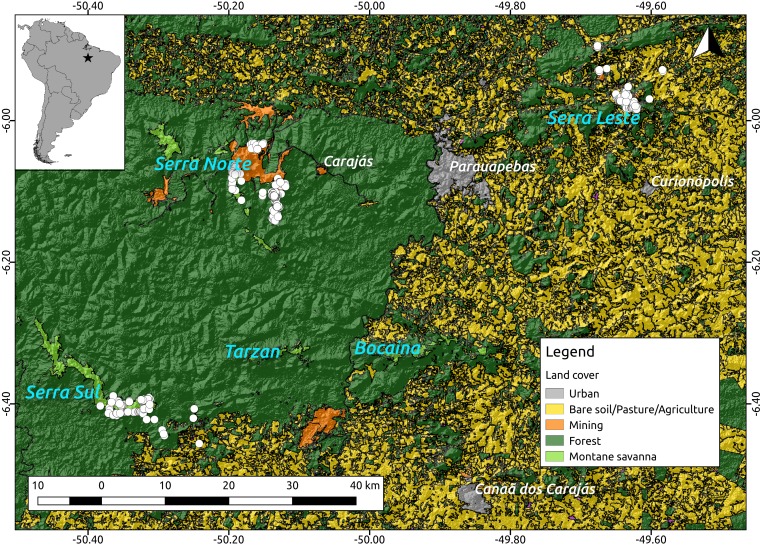
Figure 2. Location of the study region (upper left corner) and a detail of the study area showing the spatial distribution of the caves included in our analyses (white dots, N = 473) over elevation and a land cover layer.
While the digital elevation raster (SRTM, 1 arc-second) was obtained from USGS Earth Explorer, the land use classification shapefile was obtained from Souza-Filho et al. (2016). Coordinates are shown in decimal degrees.

