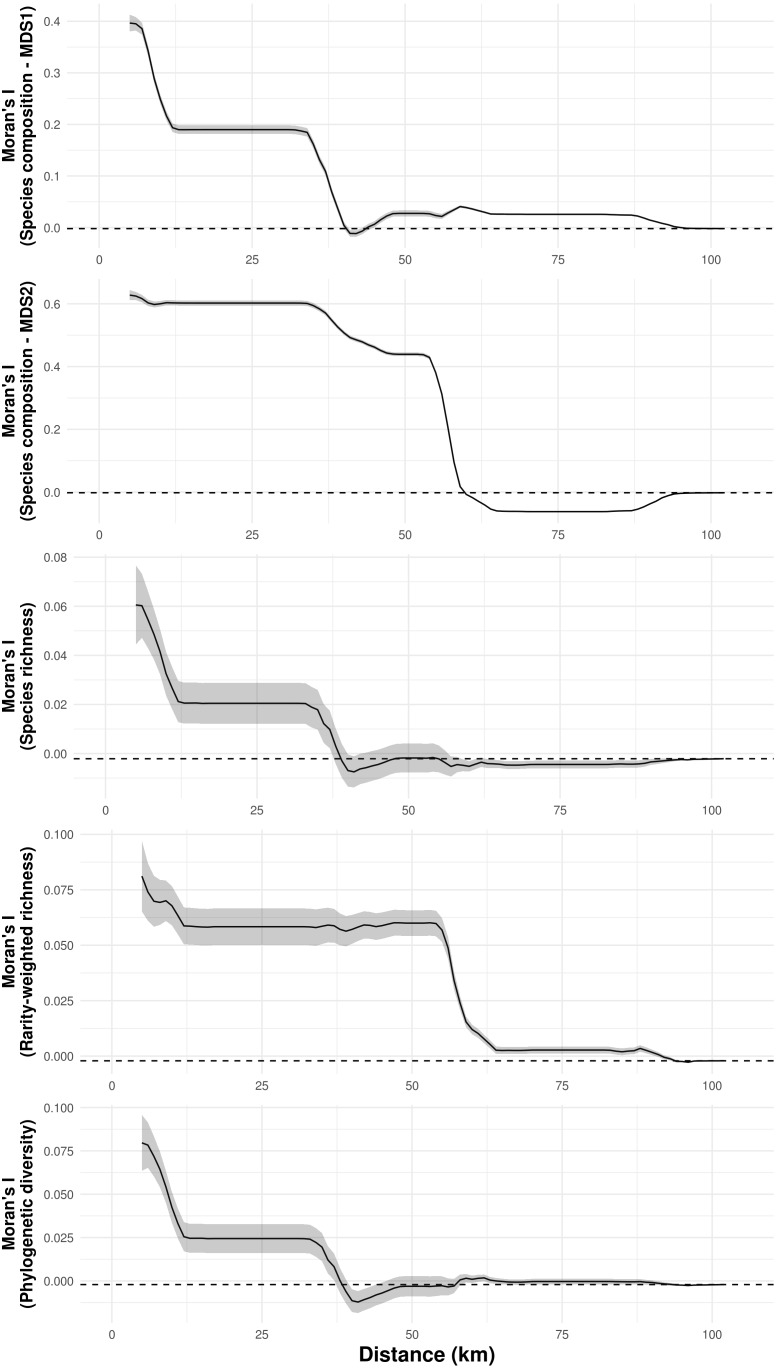
Figure 4. Spatial autocorrelation of troglobitic species composition, species richness, rarity-weighted richness and phylogenetic diversity across different spatial scales.
While the solid lines show the value of Moran’s I estimates, the gray area depict 95% confidence intervals. The dashed lines represent expected values under a null model of no spatial autocorrelation.

