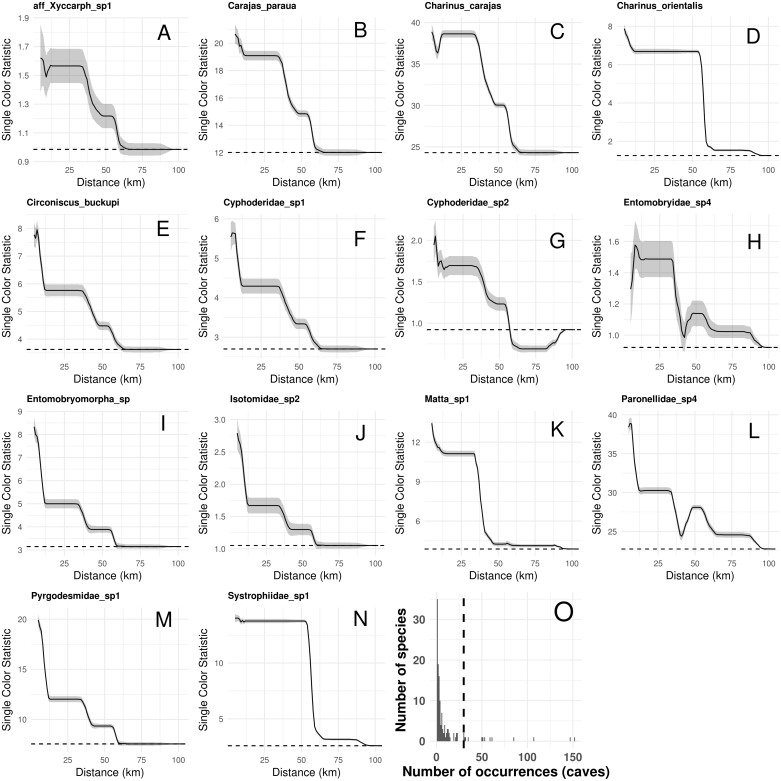
Figure 5. Spatial autocorrelation in the occurrence of the most frequent troglobitic species (occurring in 30 or more caves) across different spatial scales (A–N), and frequency distribution of occurrences by species (O).
Solid lines in A–N show the value of Single Color Statistic estimates, gray area depict 95% confidence intervals, and dashed lines represent expected values under a null model of no spatial autocorrelation. The dashed vertical line in O shows the threshold value of species occurring in at least 30 caves.

