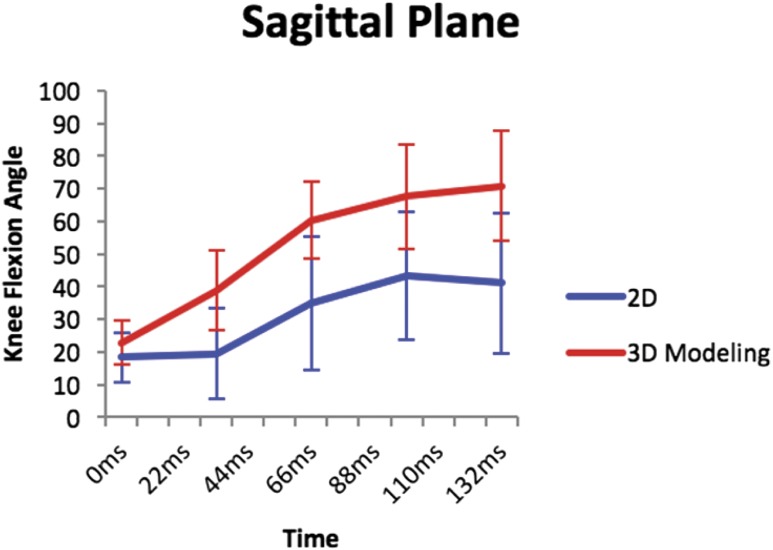
Fig. 3.
Line graph showing sagittal data points from the quantitative 2D and 3D modeling techniques (individual data from the 2D analysis were made available by one of the authors [B.P.B.] from a previous study10, and individual data from the 3D analysis3 were obtained with use of WebPlotDigitizer/app). The error bars indicate 1 standard deviation.

