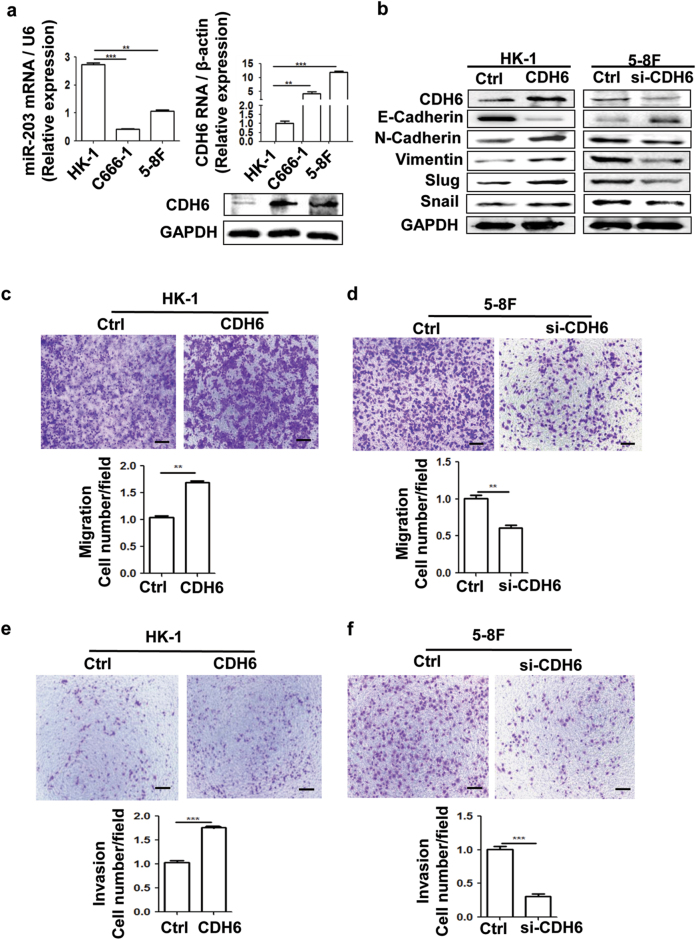
Fig. 3. CDH6 promotes EMT, cell migration and invasion of NPC cells.
a The different expression levels of CDH6 and miR-203 in NPC detected by qPCR and western blotting. Results are means ± SD; n = 3. *p < 0.05, **p < 0.01, ***p < 0.001. For the CDH6 detection by western blotting assay, the quantification analysis of band gray values from three experiments is showed in Supplemental Fig. 3. b Effect of CDH6 on the expression of EMT markers by western blotting analysis. Due to the different level of CDH6 expression background in the cells, overexpression of CDH6 (CDH6) and interference by si-CDH6 were used in HK-1 and 5-8F cells, respectively (the same below). “Ctrl” represents the empty vector control for the overexpression plasmid of CDH6 or the scramble sequenced siRNA control for si-CDH6 (the same below). The quantification analysis of band gray values from three experiments is showed in Supplemental Fig. 5. c, d Effect of CDH6 on cell migration measured by transwell assay without matrigel. c Effect of CDH6 on cell migration in HK-1 treated with overexpression of CDH6. d Effect of CDH6 on cell migration in 5-8F treated with si-CDH6 to inhibit the expression of CDH6. e, f Effect of CDH6 on cell invasion measured by transwell matrigel penetration assay. e Effect of CDH6 on cell invasion in HK-1. f Effect of CDH6 on cell invasion in 5-8F. Calibration bars correspond to 100 µm in panels c–f. Results are means ± SD; n = 3. *p < 0.05, **p < 0.01, ***p < 0.001

