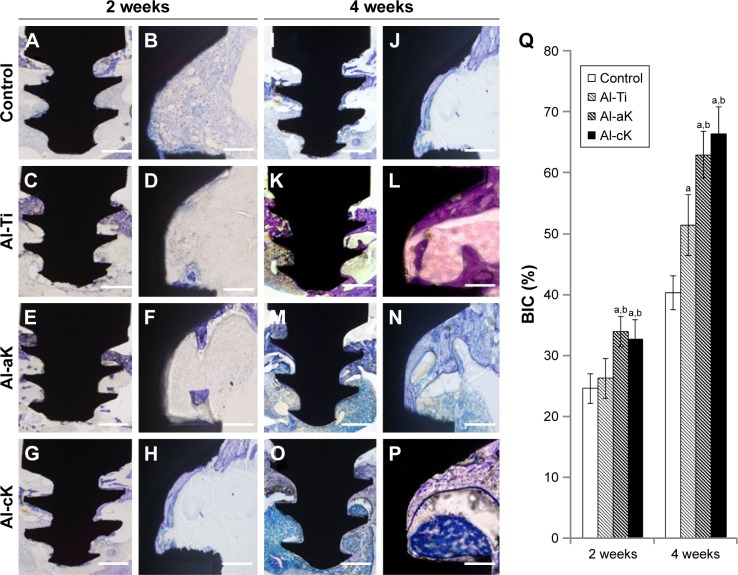
Figure 9.
Histological analysis around the TiO2 implants in vivo. Bone morphogenesis around TiO2 implants as observed under 100× magnification at 2 weeks after implantation (A–H) and 4 weeks after implantation (I–P). (A, B, I, J) Control; (C, D, K, L) Al-Ti implants; (E, F, M, N) Al-aK implants; and (G, H, O, P) Al-cK implants. Bars indicate 500 µm (A, C, E, G, I, K, M, O) and 100 µm (B, D, F, H, J, L, N, P). (Q) Average histomorphometric values of BIC.
Notes: Data are expressed as means (n=3) with error bars representing standard deviations; ap<0.05 compared to control; bp<0.05 compared to Al-Ti.
Abbreviations: TiO2, titanium dioxide; Al-Ti, alkali-treated TiO2; Al-aK, alkali-treated adsorption with kaempferol; Al-cK, alkali-treated coprecipitation with kaempferol; BIC, bone–implant contact.

