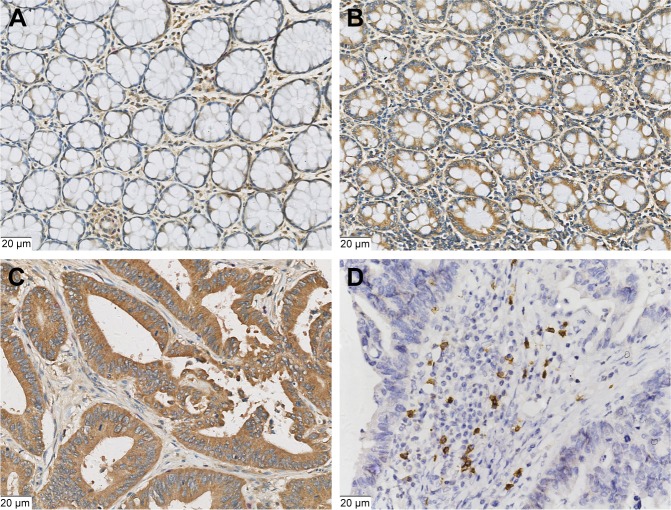
Figure 1.
Representative photomicrographs of HHLA2 expression and CD8-positive T-cell infiltration in colorectal lesions.
Notes: (A) Weak expression of HHLA2 in the adjacent intestinal epithelium tissues. (B) Positive expression of HHLA2 in the adjacent intestinal epithelium tissues. (C) High expression of HHLA2 in the CRC tissues. (D) CD8-positive expression in the T cells of stroma. (Original magnification: 400×).

