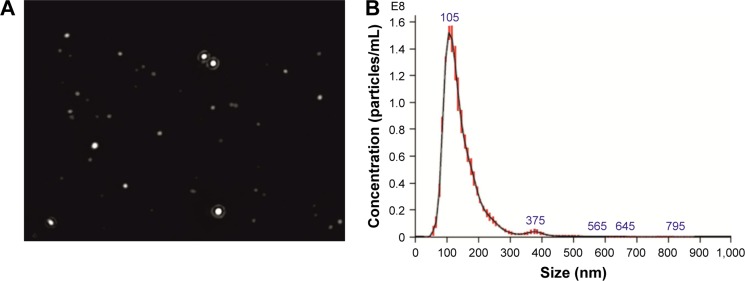
Figure 5.
EVs’ NTA.
Notes: EVs are observed at the screen shot from NTA video (A). Representative graph shows the results of particle concentration and their size measurements. NTA of this sample revealed two populations of hBM-MSC-EVs with the peak diameter of 105 and 375 nm (B).
Abbreviations: EVs, extracellular vesicles; hBM-MSCs, human bone marrow mesenchymal stem cells; NTA, NanoSight particle tracking analysis.

