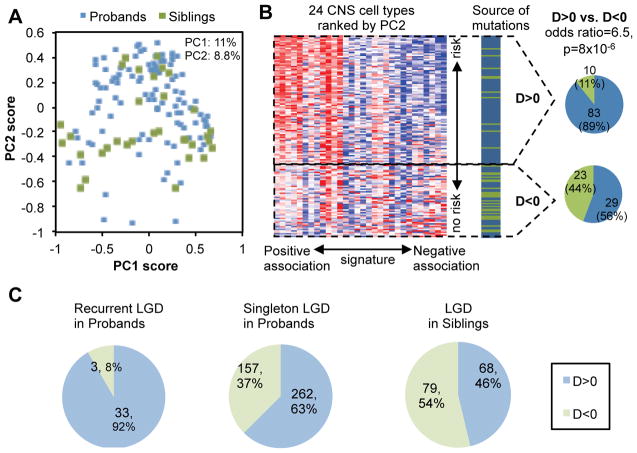
Figure 1. A molecular signature differentiates autism-susceptibility genes and non-disease genes.
A. A total of 145 genes, including 112 genes with LGD mutations in probands (blue dots) and 33 genes with LGD mutations in siblings (green dots) are projected onto the two-dimensional space defined by the first two principal components (PCs).
B. The second principal component differentiates autism-susceptibility genes and non-disease genes. In the heatmap on the left, the PC2 score and loading were used to rank genes and arrays respectively. Detail of the cell types is also shown in Figure 3B below. The source of mutation in each gene (i.e., patient or control) is indicated with genes shown in the same order. The number of genes with D-score>0 or <0 is shown on the right.
C. Summary of prediction using an expanded list of genes with LGD mutations in ASD patients and unaffected siblings.

