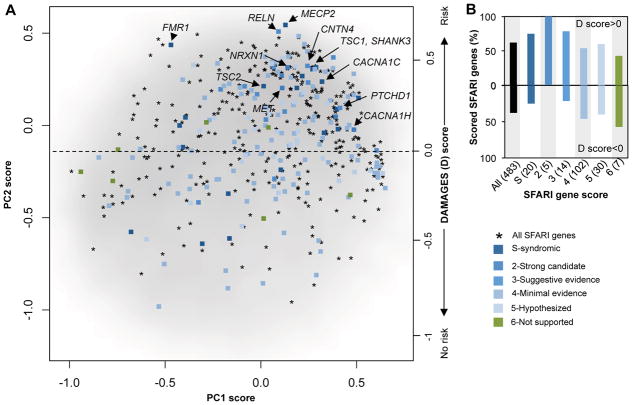
Figure 2. The DAMAGES molecular signature refines the list of candidate genes in the SFARI autism gene database.
A. All genes represented in the microarray dataset, except those with average log2 intensity <4.5, are projected onto the first two PCs, and shown as a smoothed scatter plot. The gray-scale intensity reflects the local density of genes. A total of 483 genes from the SFARI autism gene database represented in the microarray dataset (asterisks) are overlaid. A subset of these genes were manually scored by experts by considering strength of existing evidence, and these scored genes are distinguished using different colors. A subset of syndromic ASD genes and the five strong candidate genes are highlighted.
B. The percentage of scored genes in each group with a positive or negative DAMAGES score (D-score) is shown. The color codes are the same as in (A). The number of genes in each group is indicated in the parentheses following the gene categories.

