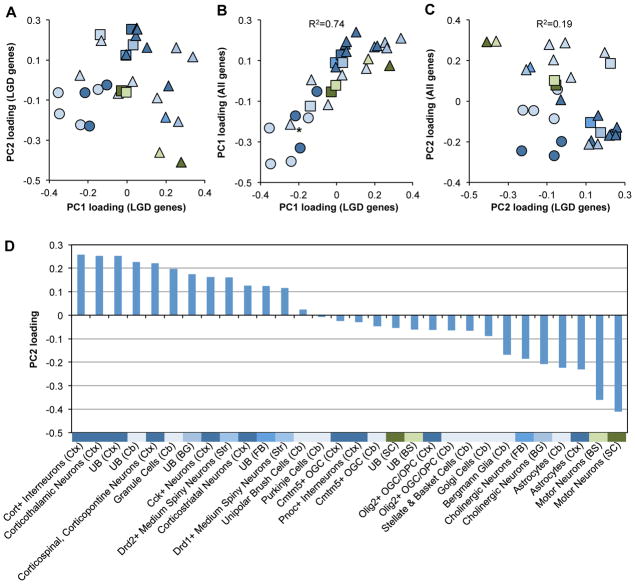
Figure 3. The DAMAGES molecular signature reveals CNS cell types associated with autism.
A. The loadings of different cell types on the first two PCs derived from genes with LGD mutations are shown. Each dot represents a cell type. Different colors represent the brain regions used to isolate the specific types of cells, with the same color codes as shown in Supp. Figure S1A. Neurons, glial cells and unselected RNA samples are represented by triangles, circles, and squares, respectively.
B. The loadings of cell types on PC1 derived from genes with LGD mutations (x-axis) are plotted against that derived from the whole dataset (y-axis). The asterisk indicates cerebellar Grp+ cells that are known to include both unipolar brush cells and Bergmann glial cells (Doyle, et al., 2008). The squared Pearson correlation between the two signatures is indicated.
C. Similar to (B), except that the loadings on PC2 are plotted.
D. Loadings of all cell types on PC2 derived from genes with LGD mutations (DAMAGES signature) are plotted. The color codes and abbreviation of each brain region are the same as shown in Supp. Figure S1A. UB: unbound RNA without selection for specific cell types.

