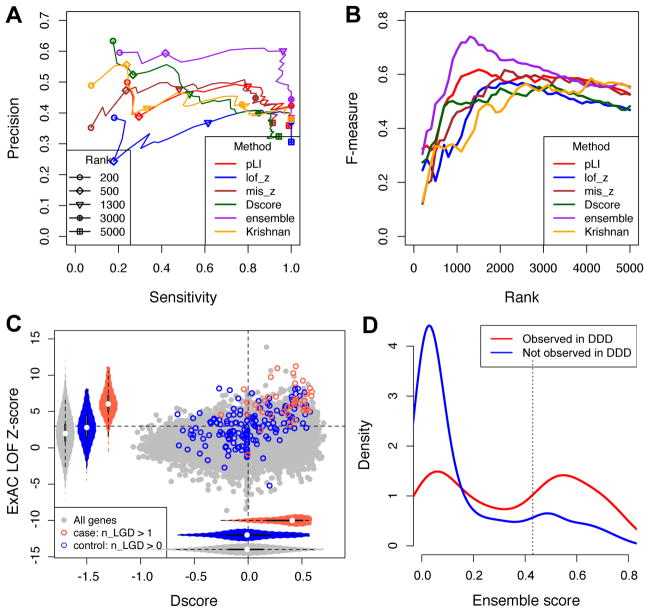
Figure 5. Comparison D-score with other methods and the ensemble model.
A. Performance of prediction as measured by Precision and Recall (Sensitivity) using different gene prioritizing methods or an ensemble model as a function of varying cutoffs. Note that Precision and Recall were estimated from the relative enrichment of mutations in patients and controls, since the ground truth whether a gene is a true positive is unavailable in most cases.
B. Similar to (A), but the F measure is shown. F measure is the harmonic mean of precision and recall and rewards a balance of the two.
C. Distribution of D-scores and ExAC LOF Z-scores for genes with recurrent LGD mutations in ASD cases and controls.
D. Distribution of ensemble score among singleton genes in which damaging de novo mutations observed (red) in the DDD data set versus the ones not observed (blue). Singleton genes refer to the ones with a single de novo LGD mutation in autism cases.

