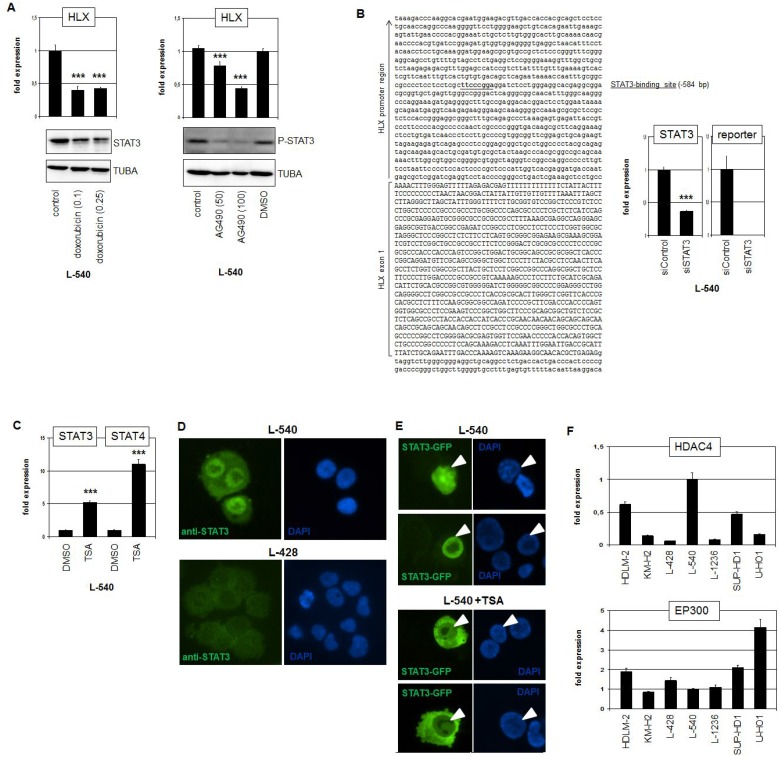
Figure 4. STAT3 activates HLX in HL.
(A) RQ-PCR analysis of HLX in L-540 cells after treatment with 0.1 or 0.25 μM Doxorubicin (left) and 50 or 100 μM AG490 (right). Western blot analyses demonstrate the treatment effects on STAT3 protein level (left) and on phosphorylation of STAT3 (right). Tubulin served as control. (B) Reporter-gene assay for the regulation of HLX expression by STAT3. The promoter region of HLX contains a potential STAT3-site (underlined) at −584 bp (left). RQ-PCR analysis of L-540 cells transfected with reporter-gene construct and siRNA (right). The expression level of STAT3 was reduced via siRNA-mediated knockdown and the activity of the reporter-gene decreased concurrently, demonstrating direct activation of HLX by STAT3. (C) RQ-PCR analysis of STAT3 and STAT4 in L-540 cells after treatment with deacetylase-inhibitor TSA. (D) Immunofluorescence analysis of L-540 and L-428 cells using STAT3-antibody (green) and DAPI as nuclear counterstain (blue). Please note the strong nuclear STAT3-signal in L-540. (E) Fluorescence analysis of L-540 cells transfected with GFP-tagged STAT3. Treatment of these cells with TSA resulted in translocation of STAT3-GFP into the cytoplasm (below), while the controls show nuclear localization of STAT3-GFP (above). Nuclei of STAT3-GFP positive cells are indicated by arrowheads. (F) RQ-PCR analysis of HDAC4 (above) and EP300 (below) in HL cell lines, demonstrating elevated and reduced expression levels, respectively, in L-540 cells.

