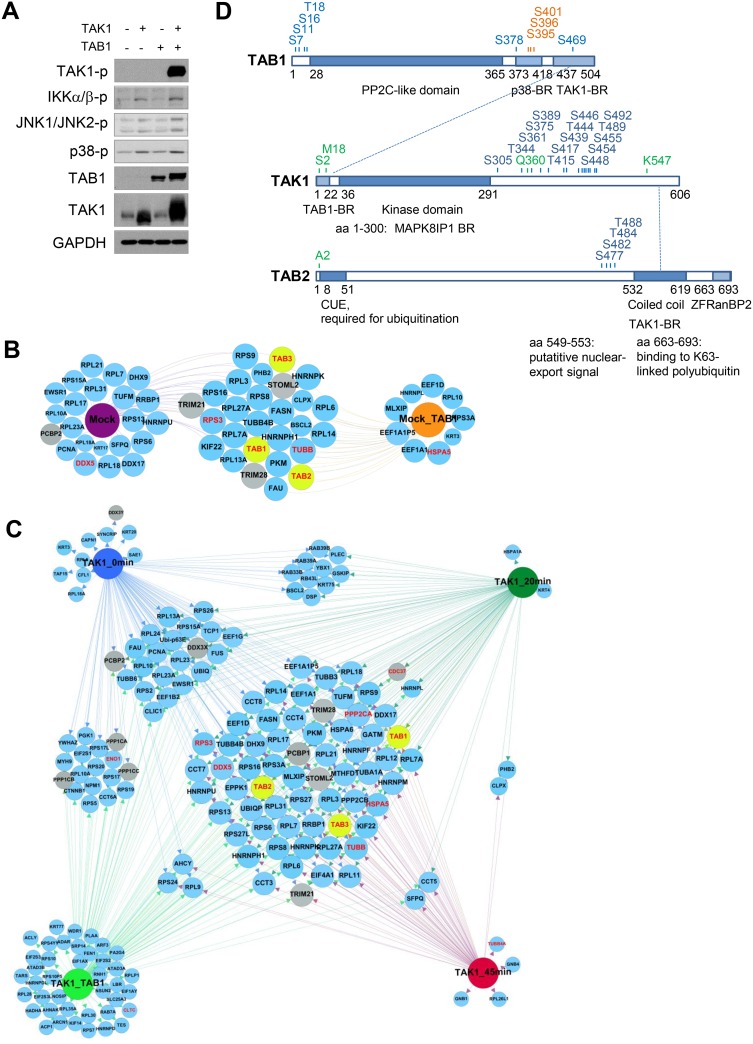
Figure 3. Dynamic TAK1 interactome in AGS cells.
(A) AGS cells were transfected with TAK1 or (and) TAB1 DNA plasmids for 24 h, cellular lysates were prepared from non-starved cells and analyzed by immunoblotting. (B) Endogenous TAK1 was immunoprecipitated from mock- or TAB1-transfected AGS cells. (C) TAK1 was overexpressed and immunoprecipitated from untreated, H. pylori-infected (for 20 and 45 min) and TAB1-co-expessing cells. The samples (B, C) were analyzed by MS. The size of the prey nodes reflects the number of bait interactions, i.e., the smallest nodes have one interaction and the largest interact with all baits. Prey that interact with all baits were positioned at the center of the network; the gray nodes represent novel interactors of interest. TAB1, TAB2 and TAB3 nodes are highlighted in yellow. The already known TAK1 interactors, which have been experimentally validated in human cells and are annotated in the databases InnateDB and IntactDB, are highlighted in red. (D) Schematic domain structure of TAK1, TAB1 and TAB2 with phosphorylated (blue), glycosylated (orange) and acetylated (green) sites detected by MS. Interactions between TAK1, TAB1 and TAB2 are shown with dotted lines. BR, binding region; CUE, coupling of ubiquitin conjugation to endoplasmic reticulum; ZF RanBP2, zinc finger domain found in Ran binding protein 2.

