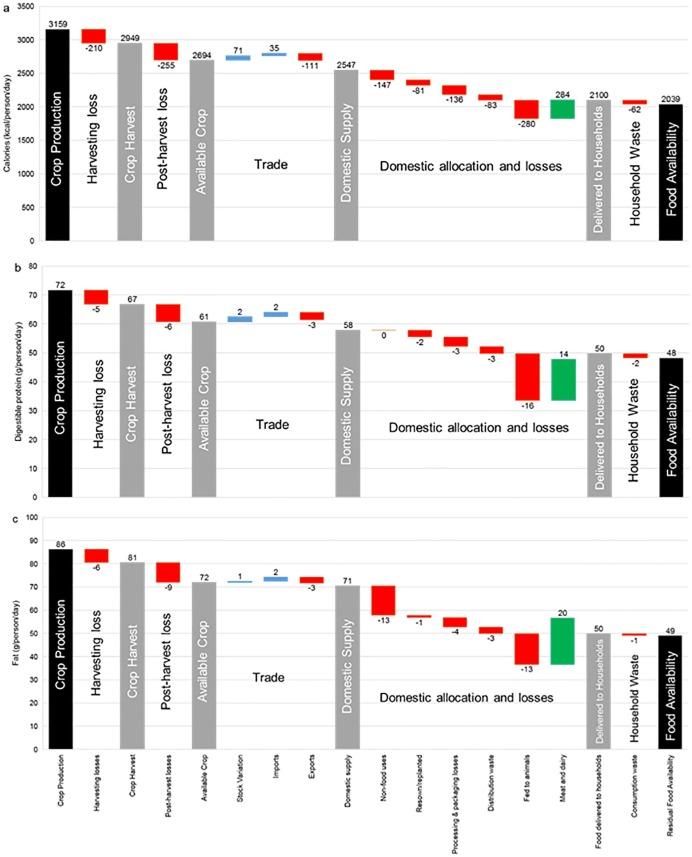
Fig 1. Production and losses in the Indian food system from ‘field to fork’ in 2011.
Food pathways in (a) calories; (b) digestible protein; and (c) fat from crop production to residual food availability, normalised to average per capita levels assuming equal distribution. Red bars (negative numbers) indicate food system losses; blue bars indicate system inputs; green bars indicate meat and dairy production; and grey bars indicate macronutrient availability at intermediate stages of the chain.

