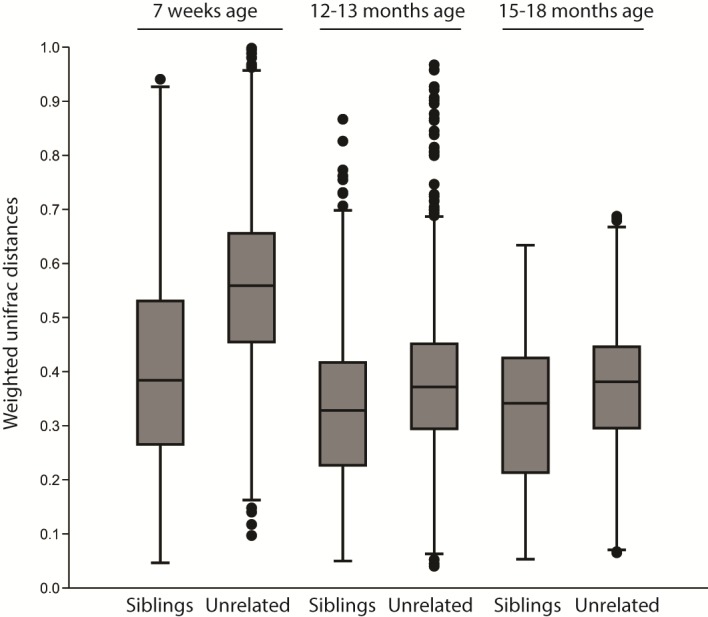
Fig 4. Boxplot showing the distribution of weighted unifrac distances comparing the microbiota between siblings and unrelated dogs at different ages.

A distance of 0 represents an identical composition of the microbiota whereas 1 represents a total dissimilarity.
