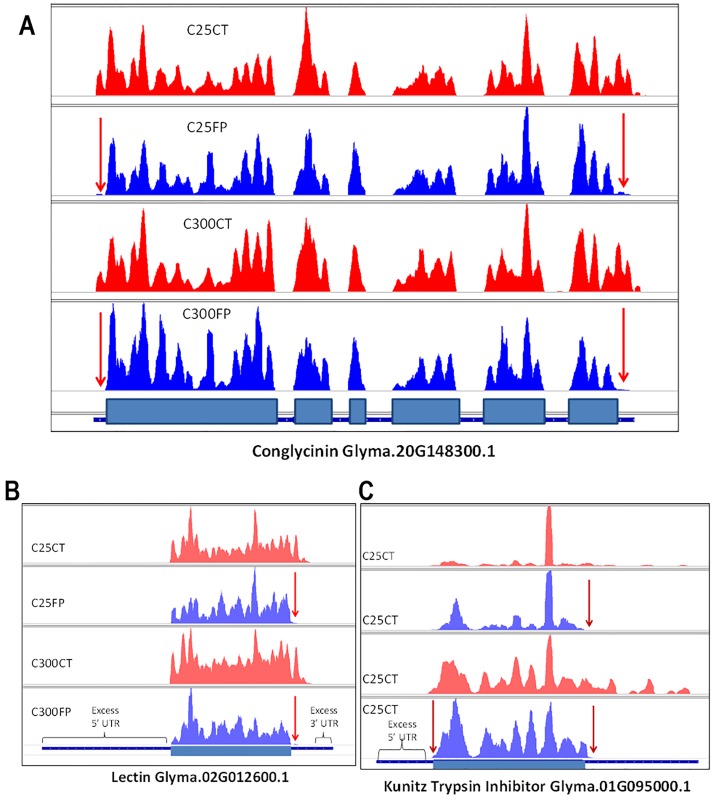
Fig 1. Integrated Genomics Viewer (IGV) displays of base coverage for gene models comparing control (CT) versus ribosome footprint (FP) libraries.
Multiple tracks for four libraries show the base coverage versus positions of the indicated gene models from alignments to the soybean reference genome. The C25CT (control) and C25FP (footprint) are libraries of the biological repeat 2 constructed from the 25–50 mg early seed development stage and C300CT and C300FP are from the late stage of 300–400 mg seed weight. The thick blue boxes at the bottom track represent exons and the thin blue boxes are either UTR regions or introns of the indicated gene models for (A) conglycinin, (B) lectin, or (C) Kunitz trypsin inhibitor. Red arrows indicate the absence of coverage in the 5’ and 3’ UTR regions of the footprint libraries compared to the control libraries. Excess 5’ UTR regions in the reference gene models for both lectin and trypsin inhibitor gene models are indicated.

