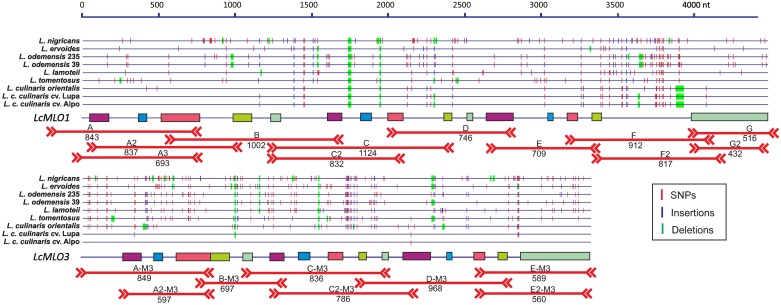
Fig 6. Intron-exon organization of Lens LcMLO1 and LcMLO3 genes.
Vertical colored bars indicate the location of SNPs (red), insertions (purple) and deletions (green) along of the genes of the species sequenced listed to the left. PCR-amplified regions are indicated with orange horizontal lines showing the corresponding primer-pair name on top. The numbers under the orange lines indicate the expected amplicon size (bp) of the “CDC Redberry” lentil cultivar.

