Figure 3.

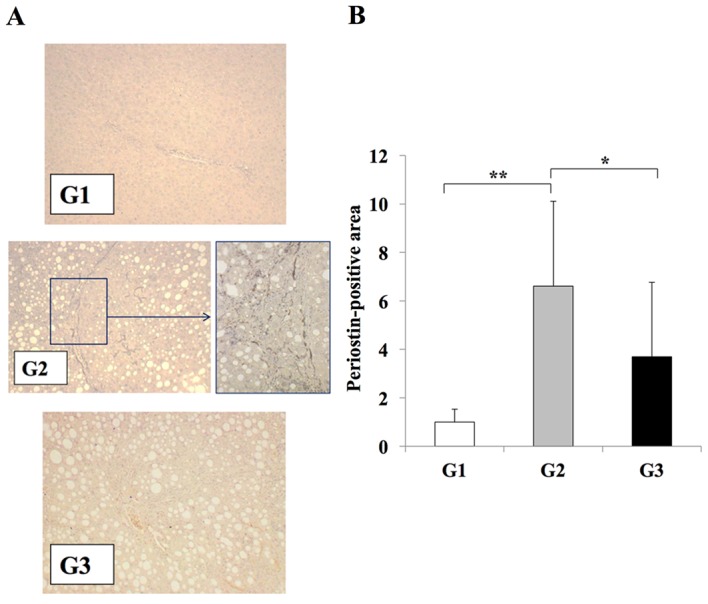
Effects of losartan on periostin expression during liver fibrosis. (A) Immunohistochemical analysis of periostin expression in the liver tissues of rats from G1, G2 and G3 experimental groups (magnification: G1, G3, ×100; G2, ×100 (left) and ×400 (right) demonstrated that periostin expression was induced in G2 group rats exclusively along the fibrotic septa. (B) Semi-quantification of the periostin-positive area using an image analyzer system. A significant reduction in periostin expression was observed in the liver tissues of rats in the G3 group when compared with the G2 group, whereas periostin expression was weak in rat liver tissues from the G1 group. The results are presented as the mean ± standard deviation (G1 and G2, n=6; G3, n=10). *P<0.05 and **P<0.01, as indicated. G1, choline-supplemented amino acid diet-fed control rats; G2, CDAA diet-fed rats; G3, losartan-treated CDAA diet-fed rats; CDAA, choline-deficient L-amino acid.
