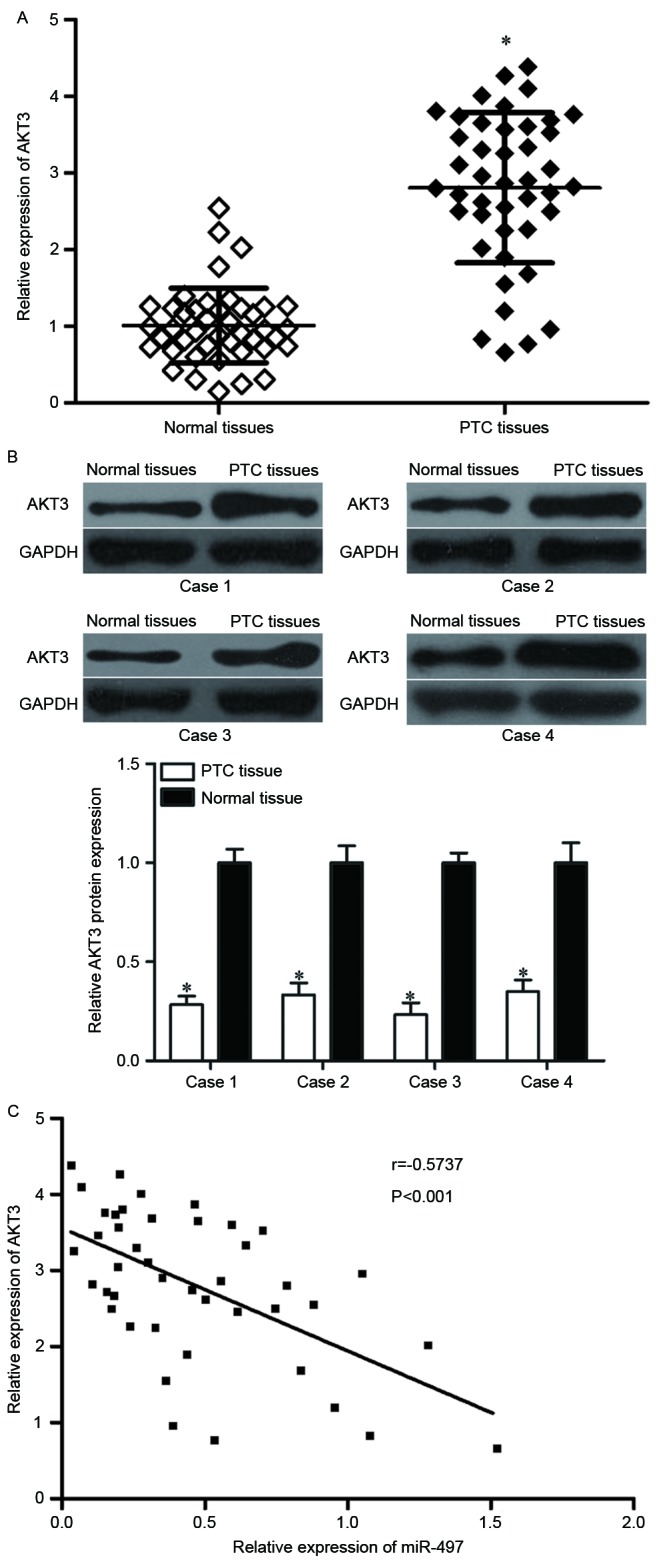
Figure 4.

AKT3 is upregulated in PTC tissues and negatively correlates with miR-497 expression levels. (A) Reverse transcription-quantitative polymerase chain reaction analysis of AKT3 mRNA expression levels and (B) representative western blot images and quantification of AKT3 protein expression levels in PTC tissues and adjacent normal thyroid tissues. (C) A negative correlation was confirmed between miR-497 and AKT3 mRNA expression in PTC tissues. Data are expressed as the mean ± standard deviation. *P<0.05 vs. normal tissue. PTC, papillary thyroid cancer; miR, microRNA; AKT3, RAC-γ serine/threonine-protein kinase.
