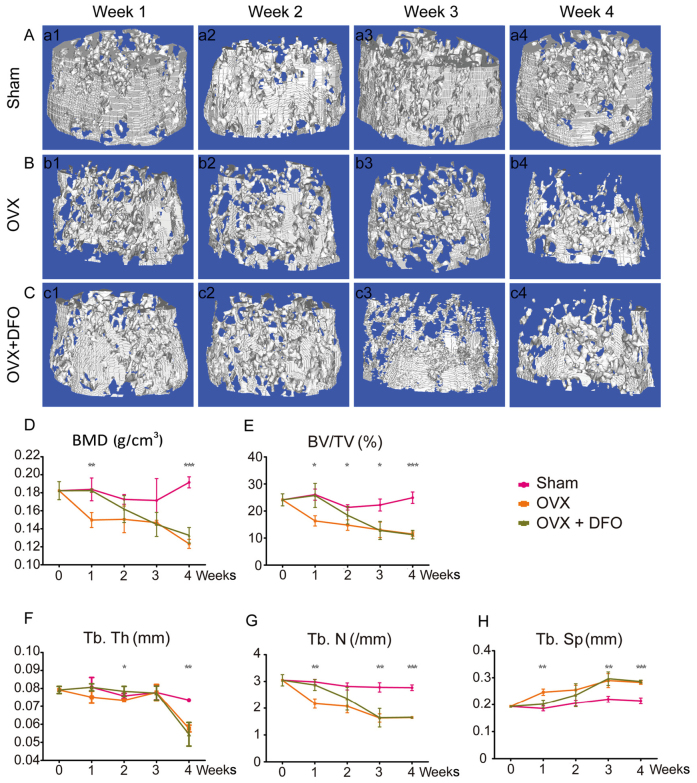
Figure 1.
Micro-CT and quantification of bone microarchitecture in distal femur. (A-C) 3D micro-CT reconstructed images of the distal femora from sham group (A-a1-a4), OVX group (B-b1-b4) and OVX + DFO group (C-c1-c4) at different time-points (week 1, 2, 3 and 4). (D-H) Quantification of BMD (D), BV/TV (E), Tb.Th (F), Tb.N (G) and Tb.Sp (H) from the sham, OVX and OVX + DFO mice. *P<0.05; **P<0.01; ***P<0.0001. Micro-CT, micro-computed tomography; OVX, ovariectomy; DFO, desferrioxamine; BMD, bone mineral density; BV/TV, bone volume/tissue volume; Tb.Th, trabecular thickness; Tb.N, trabecular number; Tb.Sp, trabecular separation.

